Advancements in cryogenic transmission electron microscopes coupled with recent breakthroughs in detectors and automation have moved single-particle cryo-EM from its revolution phase to a faster, more powerful era. Software and automation for operating transmission electron microscopes and processing data have made the technique easier and more accessible than ever. These technological developments have lowered the bar of entry to what was normally considered to be an investigative technique with a high barrier of entry and a steep learning curve. However, little has changed in the sample preparation workflow since the 1980s and remains one of the biggest obstacles to cryo-EM becoming more accessible.
Automated Sample Preparation
VitroJet is a next-generation sample vitrification robot that is designed to overcome the bottlenecks limiting the widespread use of cryoEM. VitroJet uses pin-printing and jet vitrification as core technologies to improve sample quality and consistency while also minimizing operator expertise requirements throughout the cryo-EM grid preparation workflow.
Pin Printing
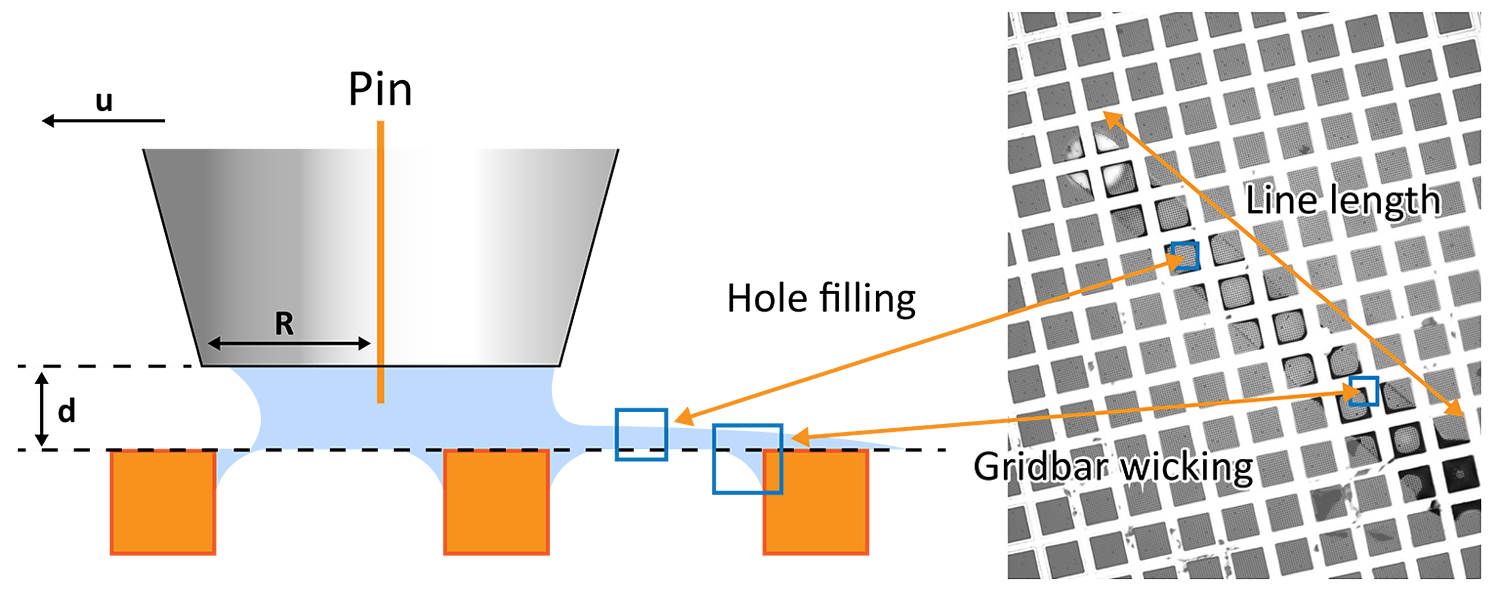
Pin printing (Figure 1) utilizes a tungsten pin to deposit picoliter volumes of samples with uniform layer thickness onto the EM grid, avoiding the need for blotting [1]. A tungsten pin with the sample droplet is maintained at a controlled temperature and dew point to prevent evaporation and condensation and is positioned about 8-15 µm away from the grid surface. A capillary bridge is formed between the grid and the pin, thereby transferring the sample to the grid without damaging it. The pin is moved quickly over the grid to cover a larger area than the tip diameter.
Figure 1: Schematic diagram showing the pin printing sample deposition process and the resulting deposited layer on an EM grid.
The deposited liquid layer thickness and printed area can be controlled by modulating key protocol parameters including standoff height (d), pin radius(R), and pin velocity (u), along with sample and grid properties. An overlapping spiral printing path, compared to a straight line, generally results in the most uniform layer thickness within the holes.
Jet Vitrification
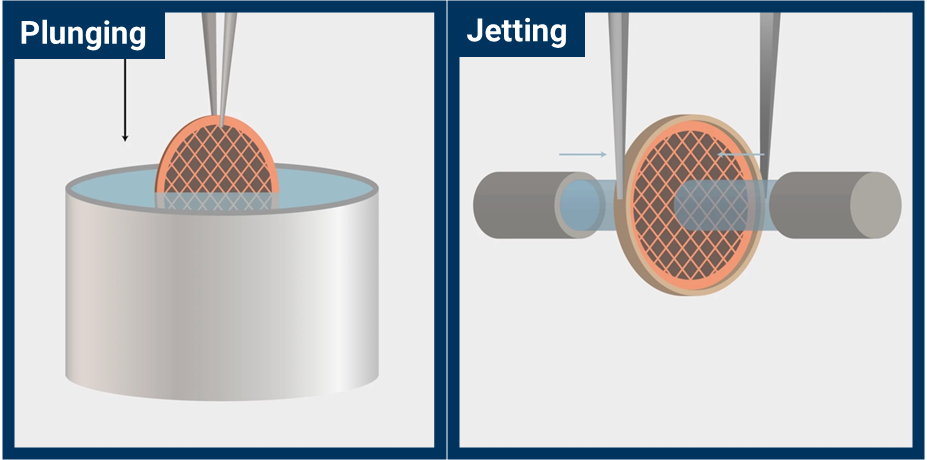
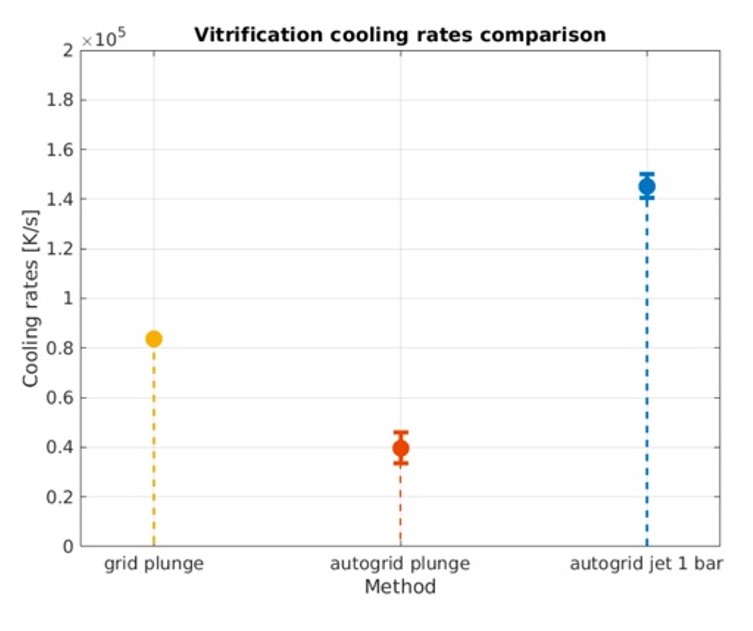
VitroJet also replaces the traditional step of plunging a grid into an ethane bath with jet vitrification from two simultaneous streams of ethane on either side of the grid (Figure 2). Jet vitrification has a higher cooling rate than plunge freezing, and this allows the use of pre-clipped autogrids (Figure 3). Users clip their grids at room temperature prior to freezing. This minimizes contamination, grid damage, and most importantly, the skill necessary to complete the step.
Several additional features enhance the reproducibility and controllability of freezing sessions. An integrated plasma cleaner eliminates the need for handling and transfer of grids to an additional instrument and provides consistent wetting to the grids prior to deposition. Dewpoint control prevents sample evaporation or condensation prior to freezing. An inline screening camera mimicking the TEM Atlas magnification provides real-time optical feedback. The deposited liquid layer within the holes can then be viewed with the VitroJet screening camera to correlate with ice thickness, minimizing the need for screening time in a TEM and freeing up precious resources in EM facilities.
Figure 2: Comparison of plunge-freezing (left) an unclipped grid and jet vitrification (right) of a pre-clipped grid in the VitroJet.
Figure 3: Vitrification cooling rate comparison of
a bare grid and an autogrid plunged in ethane compared to jet vitrification of an autogrid
Plasma treatment
60s
Printing path
Spiral
Spacing
150 μm
Standoff distance
15 μm
Velocity
2 mm/s
Pin dewpoint offset
0.5 degrees
Grid dewpoint offset
0 degrees
Sample
Apoferritin
Grid type
Quantifoil R2/1 200 Cu
Table 1: Sample preparation protocol using the VitroJet.
Sample Thickness Reproducibility
A user with no experience preparing vitrified samples was tasked to demonstrate the minimal skill level required to use the VitroJet and generate vitrified samples with uniform ice thickness. The operator is responsible for loading a cassette of up to 12 pre-clipped grids into the VitroJet, along with liquid nitrogen and three empty cryoboxes. The operator then loads a preset protocol or inputs their own settings and loads the sample into a pipette. A maximum 0.5 µL of sample is used in a full 12-grid session. In this study, a sample of apoferritin was printed onto Quantifoil grids using a protocol shown in Table 1. After the process is complete, the user retrieves their boxed frozen pre-clipped samples ready to take directly to the microscope.
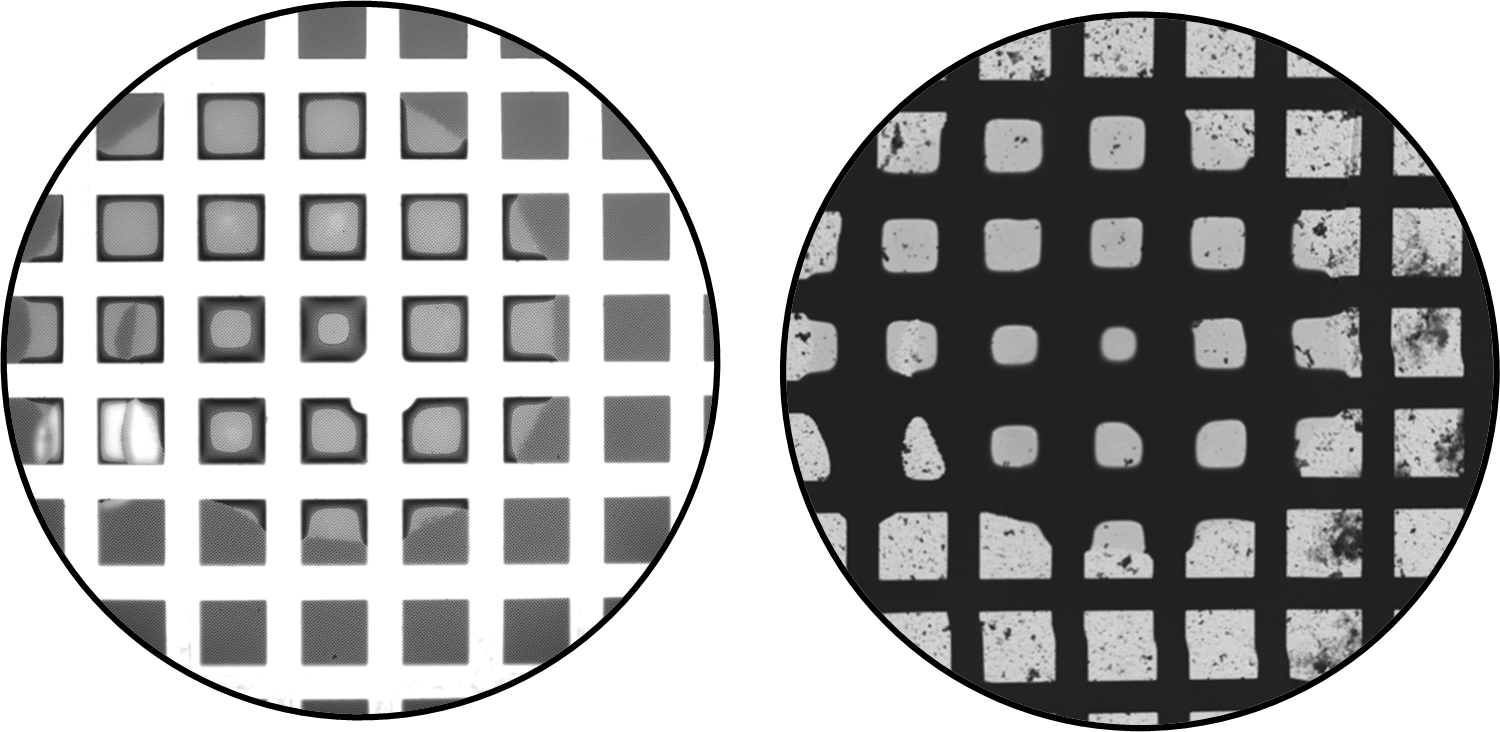
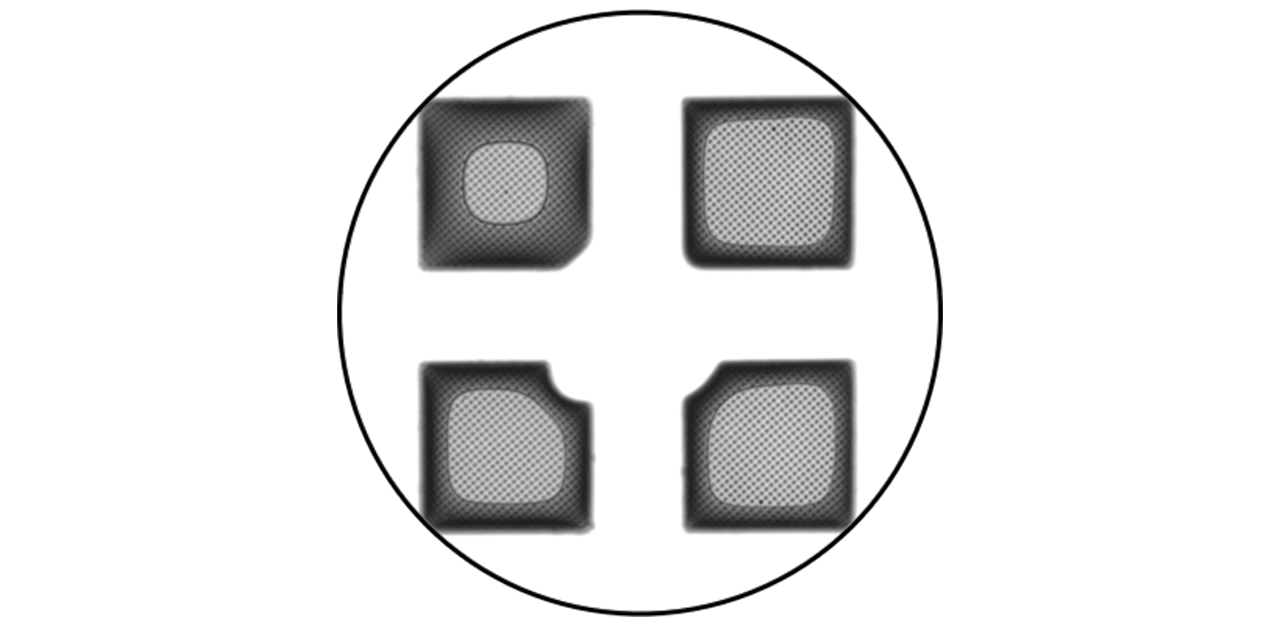
VitroJet screening camera images show the spiral pattern used in the protocol with 10 or more grid squares containing imageable ice. Figure 4 displays the deposited film from the VitroJet image and TEM Atlas of Grid 1 side-byside over the same field of view. Figure 5 is a magnified view of the VitroJet image, showing the differences in the deposited layer thickness due in part to the physical properties of the grid itself and liquid migration to the grid bars.
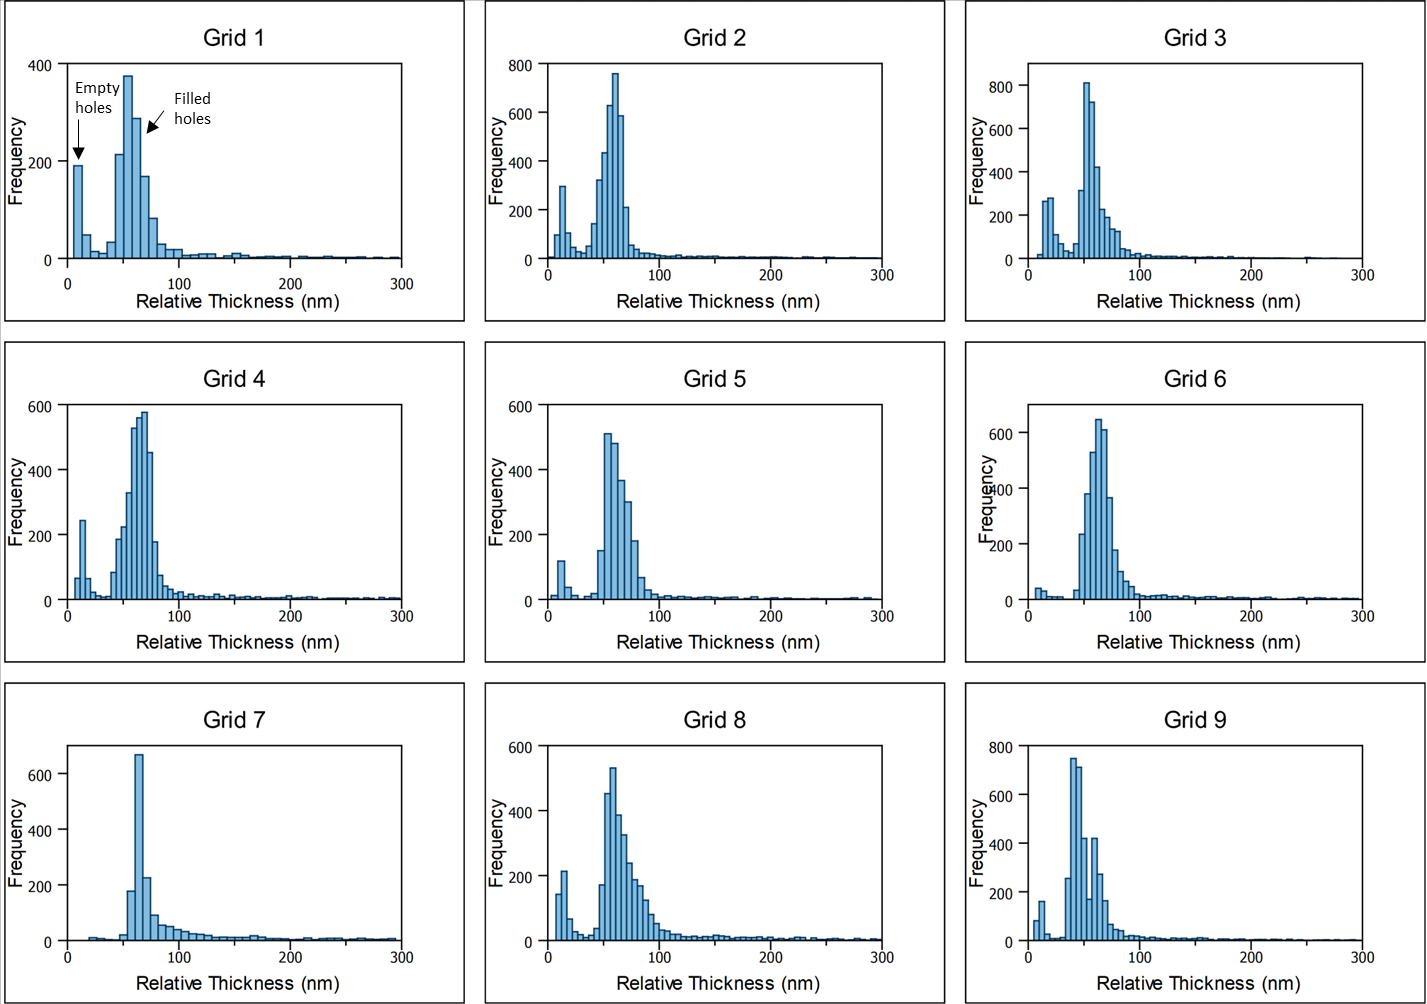
The overall quality and consistency of the grids were analyzed, and the ice thickness was measured to compare the relative thicknesses within the holes of each grid using energy-filtered TEM [2].
The grids prepared using the VitroJet yielded relative ice layer thicknesses from 0 to 300 nm as shown in the histograms presented in Figure 6. The distribution of thicknesses is concentrated into two characteristic peaks: the first peak is centered at 10-15 nm and the second peak is centered around 50-70 nm. The frequency of thicknesses drops off significantly for values over 100 nm. Further inspection of the hole locations corresponding to data points in the first peak confirmed that relative thicknesses less than approximately 30 nm corresponded to empty holes. Therefore, the imageable locations represent relative thicknesses within the second peak of the histograms: around 30-100 nm.
Figure 4: Screening (left) and TEM Atlas (right) images of Grid 1 over the same field of view.
Figure 5: Magnified VitroJet image of Grid 1, showing fluid deposition prior to jet vitrification.
Figure 6: Energy-filtered TEM ice thickness measurements of 9 cryo-EM grids containing apoferritin, prepared on the VitroJet in a first attempt by a novice user
Table 2 contains the summary statistics including the number of imageable holes (N), mean and median relative thicknesses, and the standard deviation within each grid. The prepared grids contained thousands of imageable holes per grid with a median relative thickness of 50-65 nm. The grid-to-grid variation was less than 10%. The within-grid variation is also small compared to what is typically observed on grids prepared by traditional blot-and-plunge [3]
Grid
1
2
3
4
5
6
7
8
9
N
3514
3361
3565
3565
2265
3457
1613
3152
3574
Mean (nm)
65.0
63.5
72.5
72.5
69.7
72.2
85.7
77.3
57.7
Median (nm)
59.4
57.0
65.6
65.6
62.5
64.8
66.8
65.3
48.2
St. Dev. (nm)
31.6
24.3
34.4
34.4
31.5
32.9
46.1
39.1
31.7
Table 2: Summary statistics of the relative thickness in imageable (filled) holes from each grid.
Conclusion
Traditional blot-and-plunge cryo-EM grid preparation has a steep learning curve and requires an experienced hand to consistently produce high-quality grids. The VitroJet combines several next-generation technologies in an automated platform to ensure sample consistency and accessibility to users of all skill levels. Typical grids prepared in the VitroJet contain thousands of imageable locations with minimal inter-grid and intra-grid ice thickness variability.
References:
[1] R. B. G. Ravelli, F. J. T. Nijpels, R. J. M. Henderikx, G. Weissenberger, S. Thewessem, A. Gijsbers, B. W. A. M. M. Beulen and C. L.-I. &. P. J. Peters, “Cryo-EM structures from sub-nl volumes using pinprinting and jet vitrification,” Nature Communications, vol. 11, no. 2563, pp. 1-9, 2020.
[2] J. Rheinberger, G. Oostergetel, G. P. Reschb and C. Paulinoa, “Optimized cryo-EM dataacquisition workflow by sample-thickness determination,” Acta Crystallographica Section D, vol. 77, no. 5, pp. 565-571, 2021.
[3] M. Armstrong, B.-G. Han, S. Gomez, J. Turner, D. A. Fletcher and R. M. Glaeser, “Microscale Fluid Behavior during Cryo-EM Sample Blotting,” Biophysical Journal, vol. 118, pp. 708-719, 2020.