Overview
Cyclic voltammetry (CV) is a powerful technique that allows you to elucidate the current-voltage behavior of an electrochemical system in a reduced timeframe by sweeping the voltage back and forth between 2 limits at a constant rate and recording the current response. Cyclic voltammetry can yield information about redox potential, reaction kinetics, diffusion vs. Electron transfer control, whether the species is in solution or attached to the surface, and number of electrons involved in a redox process. Other time-resolved techniques like chronoamperometry require large amounts of time to extract the steady state behavior.
What is Cyclic Voltammetry (CV)?
Cyclic voltammetry is possibly the single most popular experimental technique used by the electrochemist. However, despite this popularity many users receive little formal training about this technique. So, what is it? It is an electroanalytical experiment used to study the electrochemical properties of an electroactive species in solution or adsorbed on an electrode surface.
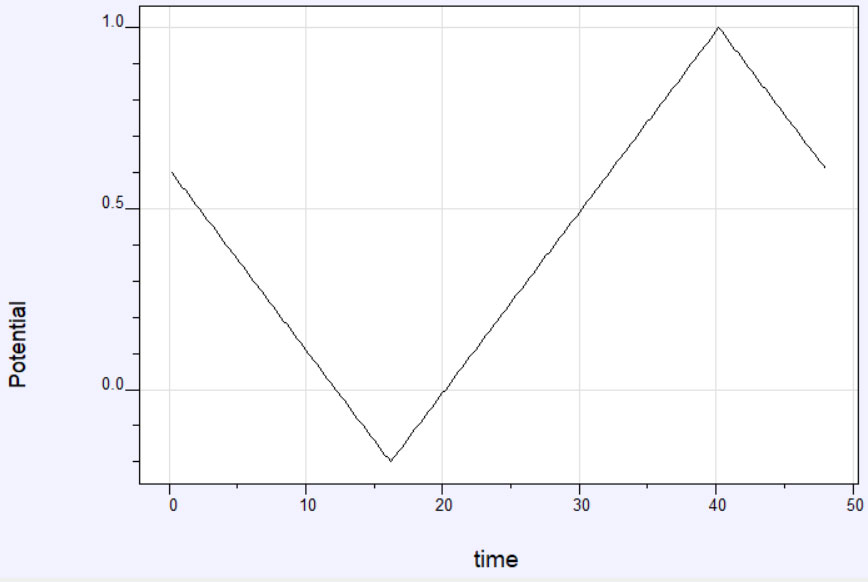
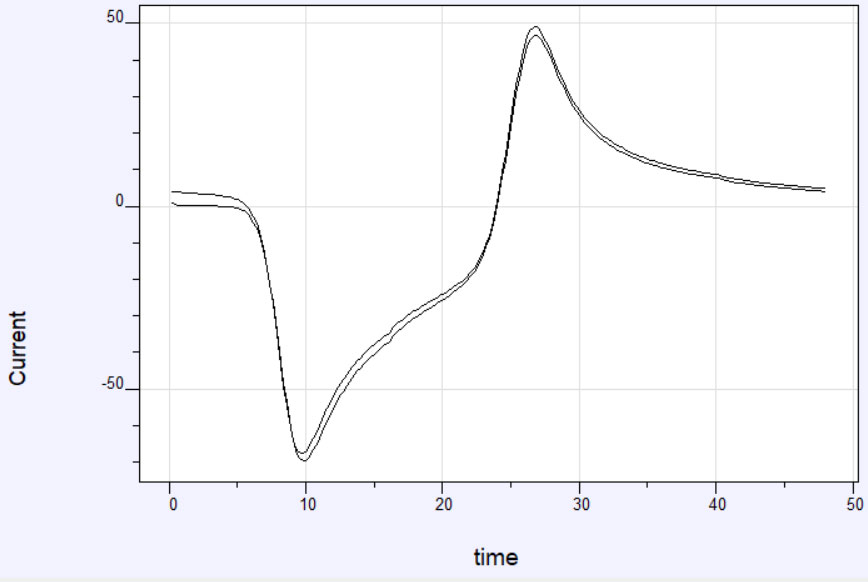
Figure 1: (a) Potential time profile for a Cyclic Voltammetry Experiment. (b) Current-time profile for a Cyclic Voltammetry experiment
A potentiostat applies a triangular potential waveform to the working electrode in an electrochemical cell and the resulting current is measured. The potential is ramped, or changed at a constant rate, until a potential limit is reached, at which point the direction of the ramp is reversed until the initial potential is reached. Typically, the potential is cycled between these limits several times. The rate at which the potential is changed is called the sweep or scan rate.
Figure 1a shows an example of the potential profile as a function of time. The corresponding current profile looks something like the graph in Figure 1b. The data can also be plotted as current vs potential and is called a cyclic voltammogram or CV. A representative cyclic voltammogram is shown in Figure 2. Data from cyclic voltammetry can yield information about redox potentials and electrochemical reaction rates. For instance, if the electron transfer at the working electrode surface is fast and the current is limited by the diffusion of analyte species to the electrode surface, then the peak current will be proportional to the square root of the scan rate.
Anatomy of a Cyclic Voltammogram
Cyclic voltammogram is plotted with the potential on the x-axis and current on the y-axis. Confusingly, there are 2 conventions for plotting the data; in the American convention, positive potential is plotted from right to left and reduction currents are plotted as positive (conversely, oxidation currents are plotted as negative). In the IUPAC convention, positive potentials are plotted from left to right, and oxidation currents are plotted as positive. Since most data is now collected digitally and computers prefer positive numbers, most people use the IUPAC convention.
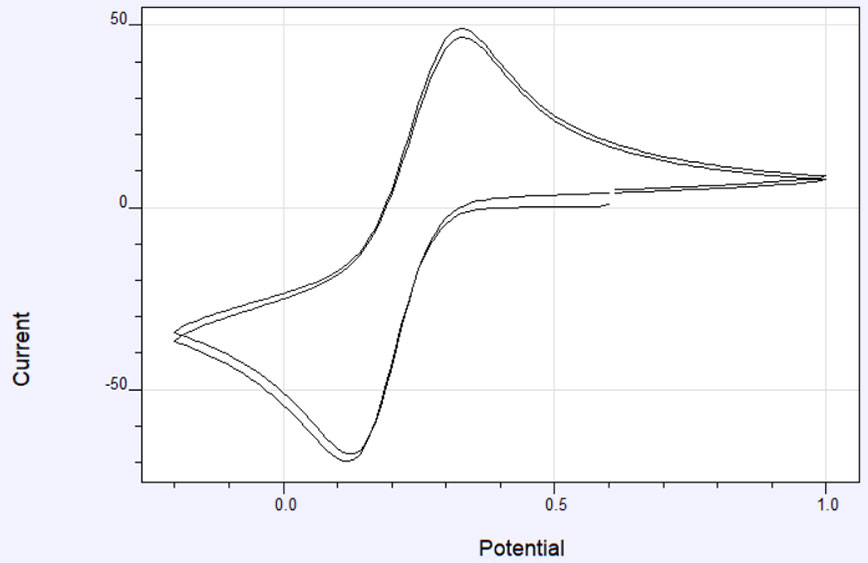
In the case of the cyclic voltammogram in Figure 2, as the potential is scanned more negatively, a point is reached where the electroactive species in the solution begin to be reduced. The current increases until the peak is reached, at which point the current is limited by diffusion of additional reactant to the surface. As the potential becomes more negative, the diffusion layer close to the electrode becomes larger and the diffusion of additional reactant is slowed, hence, the current decreases. When the potential limit is reached, the current continues to decrease until the potential reaches a point where the oxidation of the reduced species close to the surface occurs. Then the current increases in the opposite direction, reaching a peak and decreasing until the starting potential is reached.
How does the Cyclic Voltammogram get its shape?
The peaks in a cyclic voltammogram arise because of the Nernst equation, which relates the potential of the electrochemical cell to the standard potential of the electroactive species and its relative concentrations of oxidized and reduced components, at equilibrium. When the potential is scanned in a cyclic voltammetry experiment, the concentration of the species near the electrode surface changes in accordance with the Nernst Equation.
E |
= |
E0 - |
RT |
ln Q |
||
zF |
||||||
Equation 1: Nernst Equation
E is the reduction potential, E0 is standard potential, R is the universal gas constant, T is the temperature in kelvin, z is the ion charge (moles of electrons), F is the Faraday constant, and Q is reaction quotient
What information can be extracted from the Voltammogram?
A large amount of information can be extracted from cyclic voltammograms to better understand electrochemical (redox) reactions.
Redox potential (E°):
Cyclic voltammetry allows the determination of the redox potential of an electroactive species. For a reversible system, the halfway potential between the 2 peaks is the point where the concentration of the oxidized and reduced species is equal and provides a straightforward way to estimate E0, the standard potential.
Electrochemical reversibility:
The shape of the cyclic voltammogram can indicate whether the redox process is reversible, quasi-reversible, or irreversible. A reversible reaction will exhibit a well-defined, symmetrical peak, while an irreversible reaction will show an asymmetrical peak.
Diffusion coefficient (D):
Cyclic voltammetry can provide information about the diffusion coefficient of electroactive species by performing a series of experiments at different scan rates. At higher scan rates, the diffusion layer is thinner and consequently, the currents are higher. The Randles-Sevcik equation relates the peak current to the scan rate and describes how the peak current is linearly proportional to the square root of the scan rate. This is the behavior of a freely diffusing electroactive species. If the electroactive species is attached to the surface or becomes adsorbed to the surface of the electrode, a different behavior is observed. In this instance, the peak current is linearly proportional to the scan rate. This is an important way to evaluate if your reactant is adsorbed to the electrode surface.
Electroactive species concentration:
The magnitude of the current peaks in cyclic voltammetry is directly proportional to the concentration of electroactive species participating in the redox reaction. This relationship can be used to estimate the concentration of species in a solution.
Kinetic parameters and reaction mechanism:
The rate of electron transfer and the reaction kinetics can be inferred from the size, shape, and position of the peaks in the cyclic voltammogram. The number of electrons involved in the redox process can be determined and the overall pathway of the reaction.
Surface area of electrodes:
In some cases, cyclic voltammetry can be used to estimate the effective surface area of an electrode, particularly when dealing with redox-active species with known diffusion coefficients.
Electrochemical reaction mechanisms:
The cyclic voltammogram can offer insights into the electrochemical reaction mechanisms by revealing the number of electrons involved in the redox process and the overall pathway of the reaction.
Applications of Cyclic Voltammetry
Cyclic voltammetry finds application in a wide range of fields because of its ease of use and low cost of entry. Below are some areas of application that utilize cyclic voltammetry.
Electrochemical Sensors:
Cyclic voltammetry is commonly employed in the development of electrochemical sensors. These sensors can detect specific analytes based on their redox activity. For instance, glucose sensors for diabetes monitoring, environmental sensors for detecting pollutants, and biosensors for detecting biomolecules often use cyclic voltammetry.
Battery Research:
Researchers use cyclic voltammetry to investigate the electrochemical properties of materials for batteries. This includes studying the behavior of various electrode materials, electrolytes, and additives. The technique helps in optimizing battery performance, understanding degradation mechanisms, and developing new materials for energy storage.
Electroplating and Electrodeposition:
Cyclic voltammetry is used in electroplating and electrodeposition processes to control the deposition of thin films or coatings on surfaces. It aids in optimizing the deposition parameters, such as deposition potential and current density.
Medicine and Pharmaceuticals:
In pharmaceutical research, cyclic voltammetry is utilized to study the redox properties of drugs and analyze their electrochemical behavior. This information is valuable for understanding drug stability, release mechanisms, and interactions.
Fuel Cells:
Cyclic voltammetry is employed in the development and optimization of fuel cells. It helps researchers understand the electrochemical processes involved in fuel cell reactions, evaluate catalysts, and improve overall cell performance.
Electrochemical Capacitors (Supercapacitors):
Cyclic voltammetry is used to characterize the electrochemical behavior of materials used in supercapacitors. This includes studying the charging and discharging processes, as well as optimizing the performance of supercapacitor devices.