The performance of sensitive systems such as engines, hydraulics, electronics, and medical devices can be compromised in cases of particle contamination; this reduces product quality and introduces risks of failure. To prevent this, system components must meet standards of technical cleanliness (TC) to be accepted for use. Particulate quantity, size, and hardness are all considered when accepting or rejecting a component. Parts cleanliness can be evaluated with technical cleanliness analysis, also known as particulate contamination analysis.

Technical cleanliness refers to the control and assessment of particulate contamination on manufactured components, particularly those used in sensitive systems such as engines, hydraulics, electronics, and medical devices. It ensures that particles, whether metallic, non-metallic, or fibers, do not compromise product performance, reliability, or safety.1 Cleanliness is typically evaluated through standardized procedures such as ISO 16232 or VDA 19, which specify methods for particle extraction, analysis, and reporting. By managing contamination levels, manufacturers reduce the risk of failure, improve product quality, and meet industry and regulatory standards.
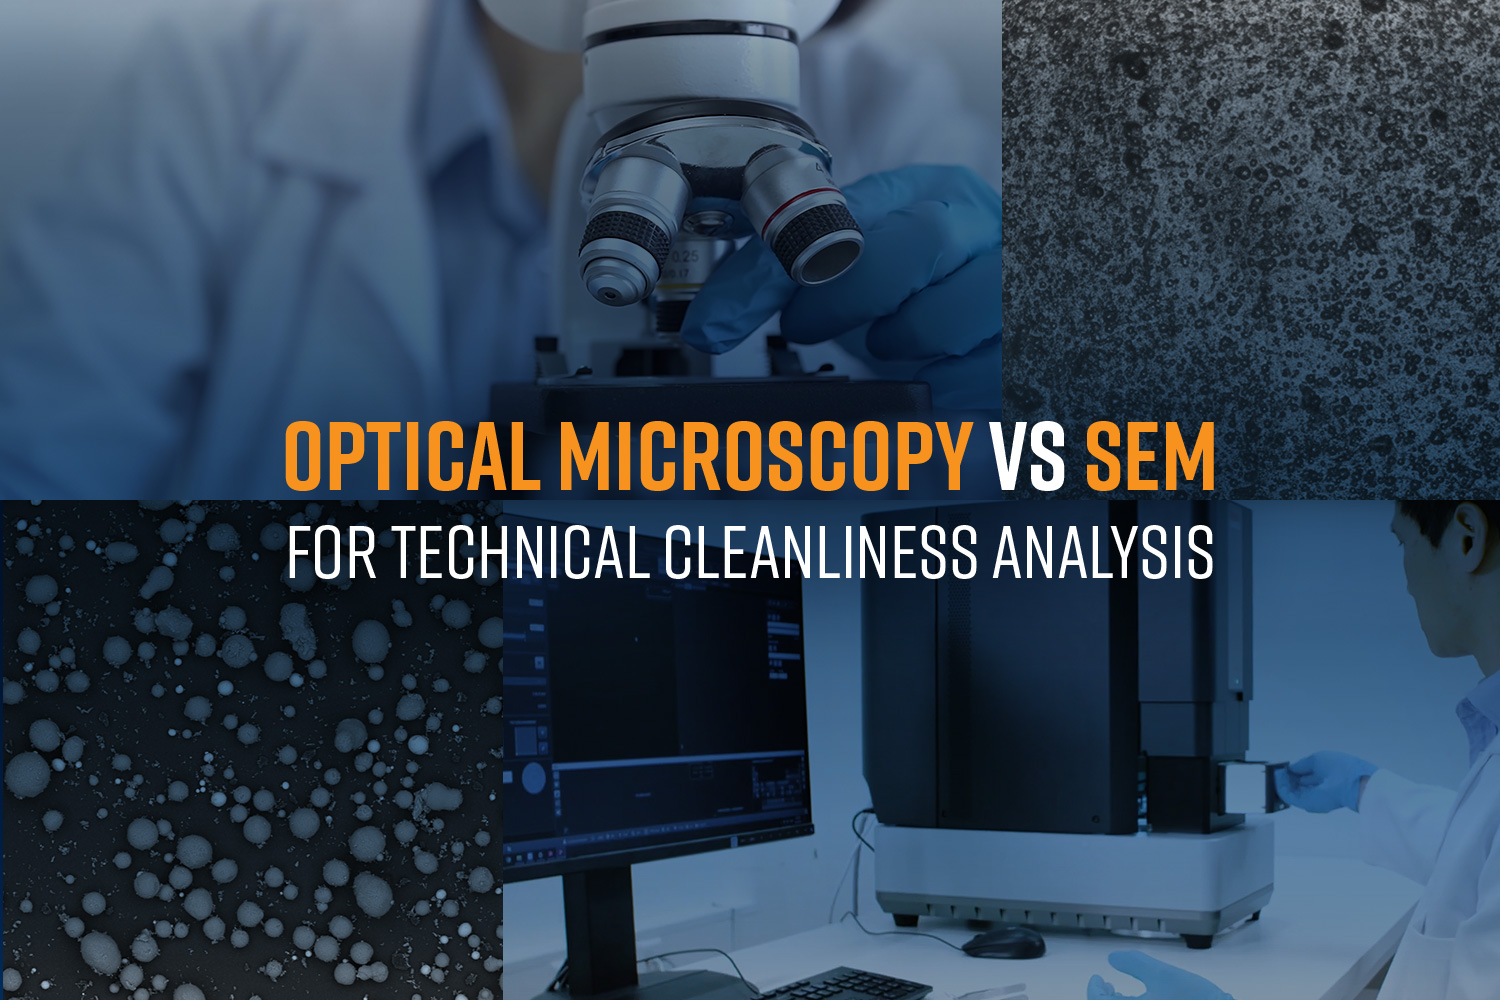
Two techniques are most used in technical cleanliness analysis: optical microscopy and scanning electron microscopy (SEM). Tables 1 and Table 2 outline some of the technical capabilities and ideal use cases for each instrument.
| Feature | Optical Microscopy | Scanning Electron Microscopy (SEM) |
| Resolution limit | ~500nm | <10 nm |
| Depth-of-field | Shallow | Deep (3D-like imaging) |
| Size measurement accuracy | Moderate (2D projection, limited focus) | High (sharp edge contrast, z-depth) |
| Minimum detectable particle size | ~5 µm (practical limit) | ~0.5 µm (or less with BSE imaging) |
| Material identification | None | EDS reveals composition(e.g., Fe, Al, Si, Cu) |
| Throughput | High (minutes per filter) | Moderate (tens of minutes to hours) |
| Operator expertise needed | Low | Higher (esp. for EDS interpretation) |
| Cost | Lower capital and operating cost | Higher initial investment and maintenance |
| Automation | High (standardized workflows) | High (advanced systems only) |
Optical Microscopy in Technical Cleanliness
Optical microscopy uses visible light and a digital camera to image a sample. Resolution in optical microscopes is limited by the wavelength of light used, resulting in resolutions of approximately 0.5 µm. Automation software can be used to scan the sample area and analyze the images for particle count, size, and concentration.2 This method is fast, cost effective, and easy to perform, but it cannot reliably detect submicron particles and may misidentify overlapping particles or aggregates. Optical microscopy is also incapable of elemental composition analysis.
SEM in Technical Cleanliness
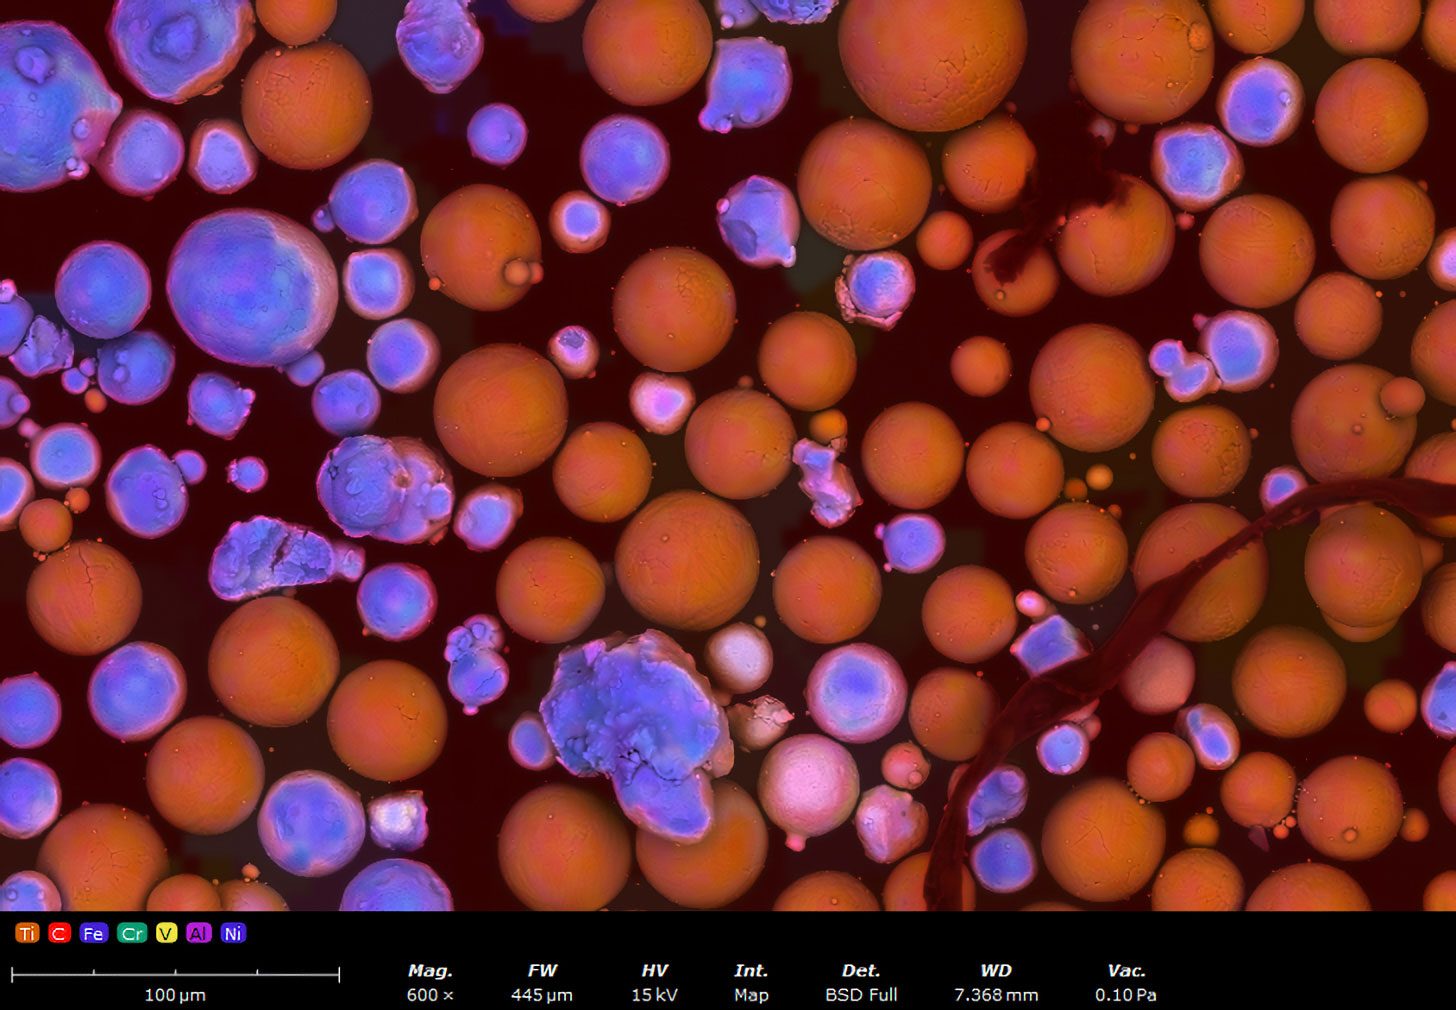
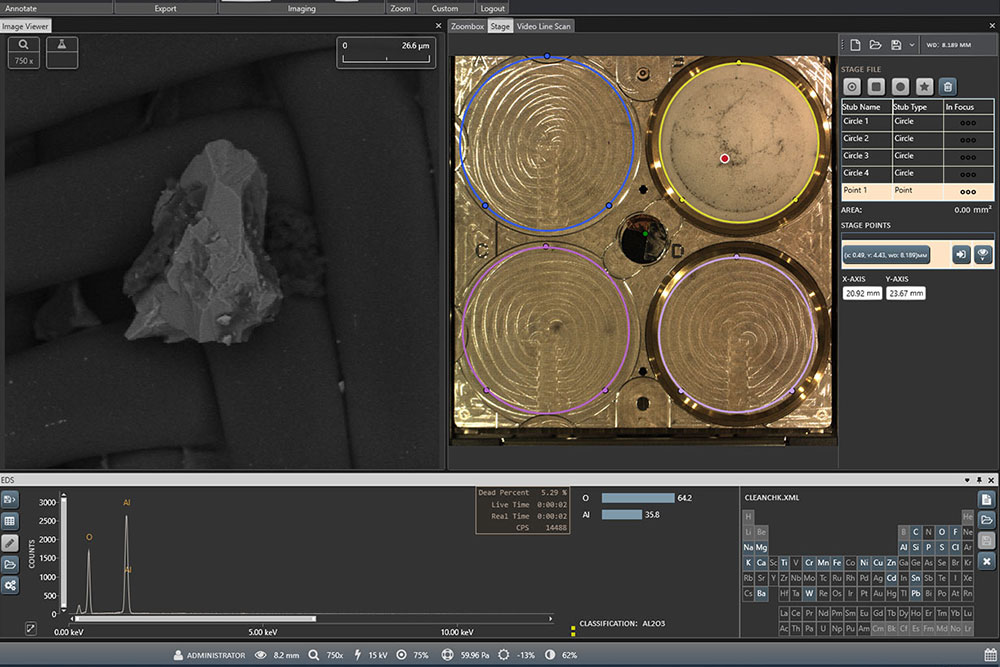
SEM uses a focused electron beam under vacuum to image a sample at high magnification. Due to the shorter wavelengths of electrons, SEMs can achieve resolutions of less than 10 nm. Improved depth-of-field view over optical microscopes also assists morphological analysis. SEM is capable of elemental composition analysis via energy-dispersive X-ray spectroscopy (EDS), making it ideal for failure analysis (Figure 1). However, SEMs are slower than optical microscopes and are not designed for high-throughput applications such as production or quality control. SEMs are also more expensive and require trained personnel to collect and interpret data.
Automated SEMs can overcome many of the limitations of standard SEMs, not only by increasing the throughput of the system but also by improving ease of use and data analytics. Automated SEM for cleanliness integrates motorized stages, autofocus, particle detection, EDS (Energy-Dispersive X-ray Spectroscopy) for elemental identification and software features for analyzing the data and generating reports.
| Use Case | Preferred Method | Rationale |
| Routine cleanliness testing (per ISO/VDA) | Optical | Fast, standards-aligned, cost-effective |
| Particle origin identification | SEM + EDS | Composition reveals source (e.g., steel shaving vs silica dust) |
| Detecting <5 µm particles (e.g., in fuel or hydraulic systems) | SEM | Optical microscopes miss fine particles |
| Production QA with traceability | Optical | Fast scanning + easy reporting workflows |
| Failure analysis, rare-event detection | SEM | High-resolution + elemental fingerprinting |
| Mixed-material (metallic + organic debris) | SEM | Clear contrast and compositional analysis |
ParticleX for Technical Cleanliness Applications
ParticleX TC is an automated SEM-EDS analysis system designed for technical cleanliness applications. Developed by Thermo Fisher Scientific, ParticleX combines SEM-EDS technology with automatic analysis software to detect, size, and chemically classify particles. Key features of the system include:
Automated SEM Imaging:
ParticleX TC scans the entire sample area using a motorized stage, autofocus, and image stitching. It detects particles down to ~ 100 nm in size with high spatial resolution.
Integrated EDS for Elemental Identification:
Particle composition information is crucial for distinguishing metallic, non-metallic, and fiber contaminants.
Efficient and Repeatable:
The fully automated workflows of ParticleX TC reduce operator bias and improve efficiency, processing over 40,000 particles per hour.
Automated Classification:
Combined SEM-EDS enables precise categorization of particles based on both shape and chemistry. (e.g. steel, silicon dust, or organic debris)
Comprehensive Reporting:
Particle size distributions, counts by material class, and cleanliness codes are included in reports generated by the system, streamlining compliance with industry standards such as ISO 16232 and VDA 19. Reports also include images and statistical summaries.
The Phenom ParticleX TC is purpose-built for critical applications such as root cause analysis of recurring contamination, supplier audits, material fingerprinting, mixed-material contamination, and validation of washing or filtration processes (Figure 2).
Beyond advanced analysis, ParticleX TC empowers organizations to streamline quality management, from documenting responses to field claims and warranty issues and drive faster internal process improvements. By reducing lab turnaround time, it enables teams to move from problem to solution more efficiently. With its intuitive platform, ParticleX TC makes it easy to communicate particle cleanliness results across vendors, internal departments, and management. Trusted by both Tier 1 suppliers and smaller automotive manufacturers, it delivers the confidence and consistency needed to strengthen compliance and quality assurance.
For organizations new to particle cleanliness initiatives, partnering with a contract laboratory service provides a complete turnkey solution. From installation to training and ongoing support, organization will have everything they need to accelerate adoption and realize immediate value.
Conclusion
Both optical microscopy and SEM play essential roles in technical cleanliness analysis. While optical microscopy is best for routine inspections where speed and simplicity are crucial, SEM-EDS provides the resolution and chemical insight necessary for complex contamination scenarios, diagnosing failures, or distinguishing materials. When utilized effectively, these instruments provide a complete, scalable solution to meeting stringent quality standards while maintaining operational efficiency.
ParticleX addresses the limitations of traditional SEM-EDS with automation, improving throughput and efficiency. Classification and reporting tools tailored to industry standards empower manufacturers to move beyond size-based cleanliness ratings and towards material-specific root cause prevention. This is a critical step in achieving zero-defect production.
References
- Faber, J.; Brodzik, K.; Nycz, M. Understanding technical cleanliness: importance, assessment, maintenance. Silniki Spalinowe/Combustion Engines 2021, 186 (3), 41–50. https://doi.org/10.19206/ce-140531. ↩︎
- Panusch, T.; Möhle, R.; Zwinkau, R.; Deuse, J. Reduction of human effort in technical cleanliness inspection through advanced image processing approaches. In Lecture notes in networks and systems; 2021; pp 108–115. https://doi.org/10.1007/978-3-030-80462-6_14. ↩︎