In today’s precision-driven manufacturing landscape, part cleanliness isn’t just a quality benchmark, it’s a critical factor that can make or break product performance and reliability. This is especially relevant in industries like automotive, aerospace, and medical devices, as microscopic contaminants can cause significant downtimes in production and degrade product quality. Traditional cleanliness inspection methods, including optical microscopy, often fall short in providing the resolution and compositional analysis needed to accurately identify contamination sources.
To address these challenges, many manufacturers are turning to automated scanning electron microscopy (SEM) combined with energy dispersive X-ray spectroscopy (EDS). This powerful duo offers a fast, accurate, and reproducible way to detect and count particles on critical surfaces while also identifying their composition and quantifying their shape and size. In this article, we’ll explore how integrating automated SEM/EDS into your technical cleanliness workflow can help you quickly identify “killer” particles, ensure compliance with standards like VDA 19 and ISO 16232, and ultimately save money wasted on excess manufacturing costs and scrapped parts.
What is Technical Cleanliness and Why is it Important?
In advanced manufacturing, even microscopic particles can compromise product quality, reliability, or safety. Contamination introduced during machining, assembly, or from the environment can damage downstream equipment, reduce product performance, or lead to premature component failure. Figure 1 shows potential types of damage that can result from undesired microscopic particles.
Figure 1. Potential types of damage that result from unwanted abrasive microscopic particles.
Technical cleanliness (TC) refers to the methods and standards used to ensure that parts, assemblies, and manufacturing environments are free from harmful particulate contamination. In critical industries, standards like VDA 19 and ISO 16232 define procedures for detecting, quantifying, and classifying these contaminants on functional components.
These standards not only provide a common language between OEMs and suppliers regarding acceptable contamination levels, but also serve as a framework to trace contamination sources, validate cleaning processes, and improve overall manufacturing quality.
What are Examples of Contaminant Particles?
In TC evaluations, identifying the type and origin of contaminant particles is just as important as detecting them. Different particles can indicate issues at various stages of the production process, from raw materials and machining to assembly and packaging. While standards like VDA 19 and ISO 16232 define the framework for evaluating cleanliness, understanding the nature of these contaminants is essential for pinpointing sources and improving process control.
Some common categories of contaminant particles found in technical cleanliness analyses include:
Hard Abrasive Particles:
These originate from surface treatment processes such as grinding and polishing. Their hardness makes them particularly harmful to sensitive components like fuel injectors or hydraulic systems. Examples of hard abrasive particles include silicon carbide (SiC), aluminum oxide (Al₂O₃), glass beads, and steel shot or round steel beads.¹
Environmental Contaminants:
Particles from the surrounding environment can settle on components during storage or assembly, especially in areas without proper cleanliness controls. Airborne dust, aluminosilicates, silicon dioxide (SiO₂), and general dirt or soil are few of the examples of environmental contaminants.²
Corrosion and Wear Debris:
These particles often signal component degradation or improper material handling and can originate from tools or machinery on the manufacturing floor. Examples include steel or iron corrosion flakes, brass shavings, machining debris, and wear particles from friction testing.³
Residue from Fluids and Surface Treatments:
Inadequately rinsed or dried parts can retain chemical residues that crystallize or leave behind film-based contaminants including residue from lubricants, cleaning agents, and coating materials.
Organic and Fibrous Particles:
These are typically introduced during manual handling, assembly, or packaging. Though less damaging than metallic debris, they can still affect sensitive systems, particularly those requiring high purity. Synthetic or natural fibers (from clothing, gloves, or wipes), paper dust, and organic fragments from people are a few of the commonly detected organic and fibrous particles.
What are “Killer Particles”?
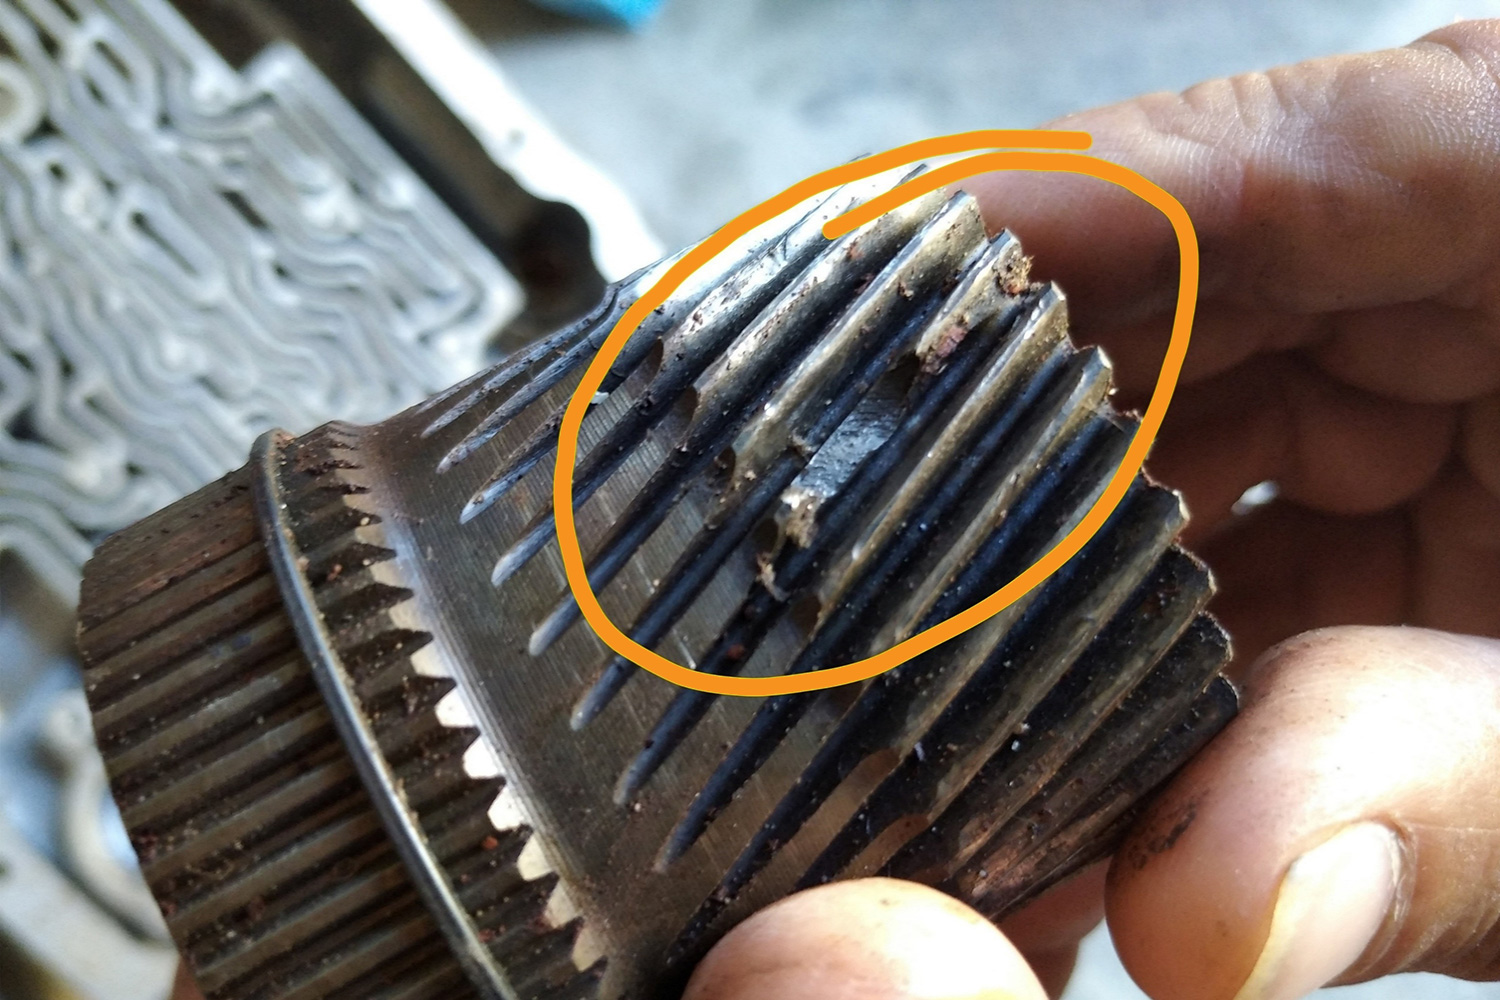
While many particles may be benign in small amounts, a single critical contaminant, known as a killer particle, can lead to catastrophic failure in high-precision systems. Killer particles are typically hard, metallic, or abrasive and fall within a specific size range that allows them to lodge in or damage tight tolerances, sensitive sealing surfaces, or fluid pathways. Their presence underscores the importance of not just measuring overall cleanliness levels but also identifying and mitigating the types of particles that pose the greatest functional risk to a component or system. Figure 2 shows an example of a component failure caused by a killer particle.
Figure 2. Example of a precision-machined part showing visible signs of damage by an abrasive “killer” particle.
Using SEM/EDS for TC Analysis and Killer Particle Identification
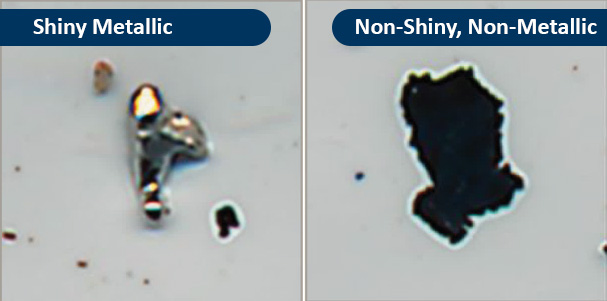
An optical microscope can offer a basic classification of particles as metallic or nonmetallic based on their visual appearance, primarily their reflectivity. Shiny particles are typically assumed to be metallic due to their ability to reflect light, while dull or matte particles are generally classified as nonmetallic (Figure 3). However, this method is subjective and can lead to misclassification, especially when dealing with coated, oxidized, or composite particles that may not clearly exhibit these visual cues. It also fails to provide the exact composition of the particles, making it difficult to pinpoint potential contamination sources.
Figure 3. Optical microscope images of two different types of particles found in technical cleanliness evaluation (images courtesy RJL Micro & Analytic in Karlsdorf-Neuthard Germany).
In SEM, backscattered electron detector (BSD) contrast provides a clear distinction between materials based on atomic weight, where metallic particles appear bright, and nonmetallic materials appear darker. This visual assessment is then validated by EDS, which provides precise elemental composition.
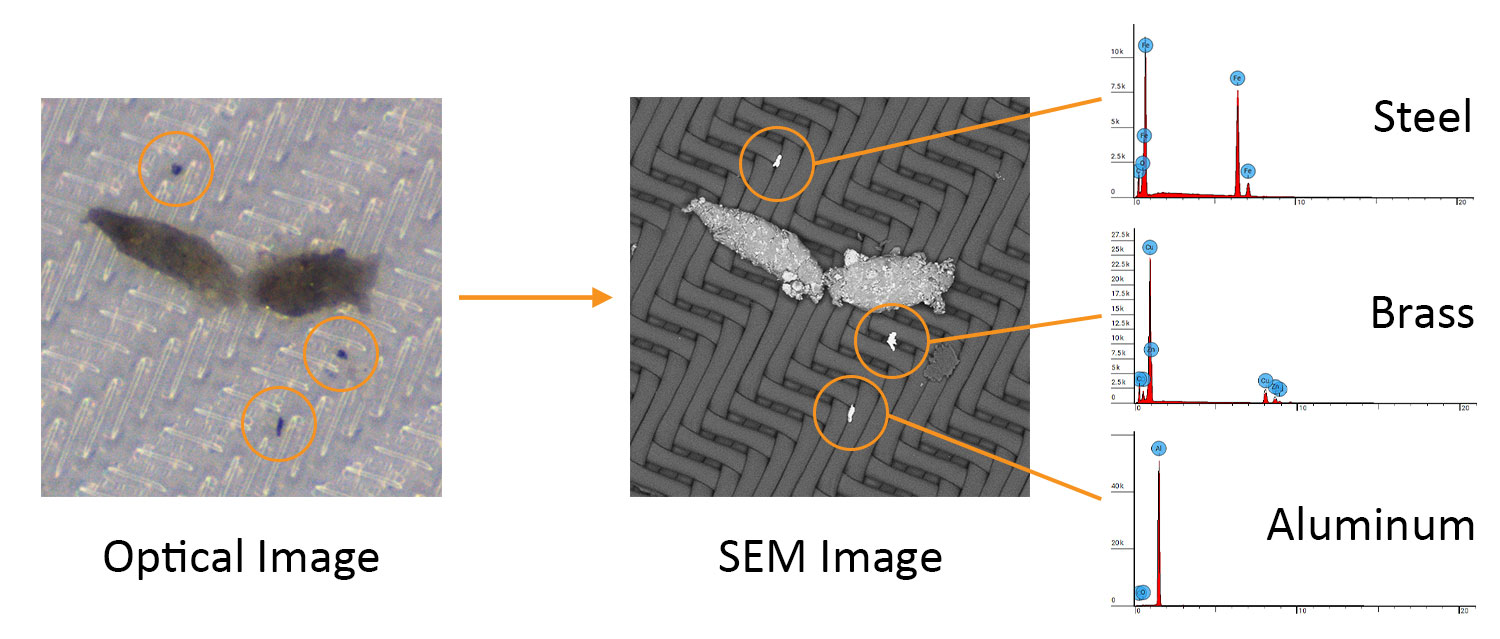
In one example, three small particles collected on a filter (Figure 4) appear dark and opaque in the optical image, suggesting non-metallic content. However, the SEM image reveals a bright BSD contrast, and the EDS spectra confirms they are in fact three distinct metallic particles: steel, brass, and aluminum.
Figure 4. Comparison of optical and SEM images of three small particles collected on a filter, along with their corresponding EDS spectra. While the optical image suggests nonmetallic material based on dark contrast, SEM/EDS analysis confirms the particles are metallic—specifically steel, brass, and aluminum (images courtesy RJL Micro & Analytic in Karlsdorf-Neuthard Germany).
In another example, two transparent particles are barely visible in the optical image (Figure 5). Their low contrast in the optical image also makes it difficult to detect through manual inspection or even automated particle detection software. When relying solely on optical methods, such particles may be missed entirely, reducing the accuracy and completeness of the technical cleanliness analysis. This limitation is easily overcome with SEM/EDS. In this case, SEM imaging clearly revealed the particles via BSD contrast, and EDS analysis identified them as aluminum oxide and glass beads, both of which are considered killer particles due to their extreme hardness and potential to damage sensitive components. These insights highlight the importance of a complete analytical approach, where SEM/EDS ensures critical contaminants are not only detected but accurately classified.
Figure 5. Comparison of optical and SEM images of particles which appear transparent in the optical view but are clearly visible in a SEM image. The EDS spectra of each particle shows they are aluminum oxide and glass (images courtesy RJL Micro & Analytic in
Karlsdorf-Neuthard Germany).
Automated TC Analysis with Phenom Perception Software
Automated TC analysis with Perception software enables unattended operation, allowing entire samples (or multiple samples) to be analyzed without constant user supervision. This not only improves efficiency but drastically reduces operator-induced variability and bias. By removing the manual steps traditionally required for detection, measurement, and classification, automation ensures faster access to meaningful data, especially when analyzing thousands of particles. The software can quickly identify features across a large area, zeroing in on critical or rare particles, the “needle in a haystack” that might otherwise go unnoticed. Automated reporting supports compliance with industry standards such as ISO 16232 and VDA 19, giving manufacturers confidence in both data quality and regulatory adherence.
How Does Perception Work?
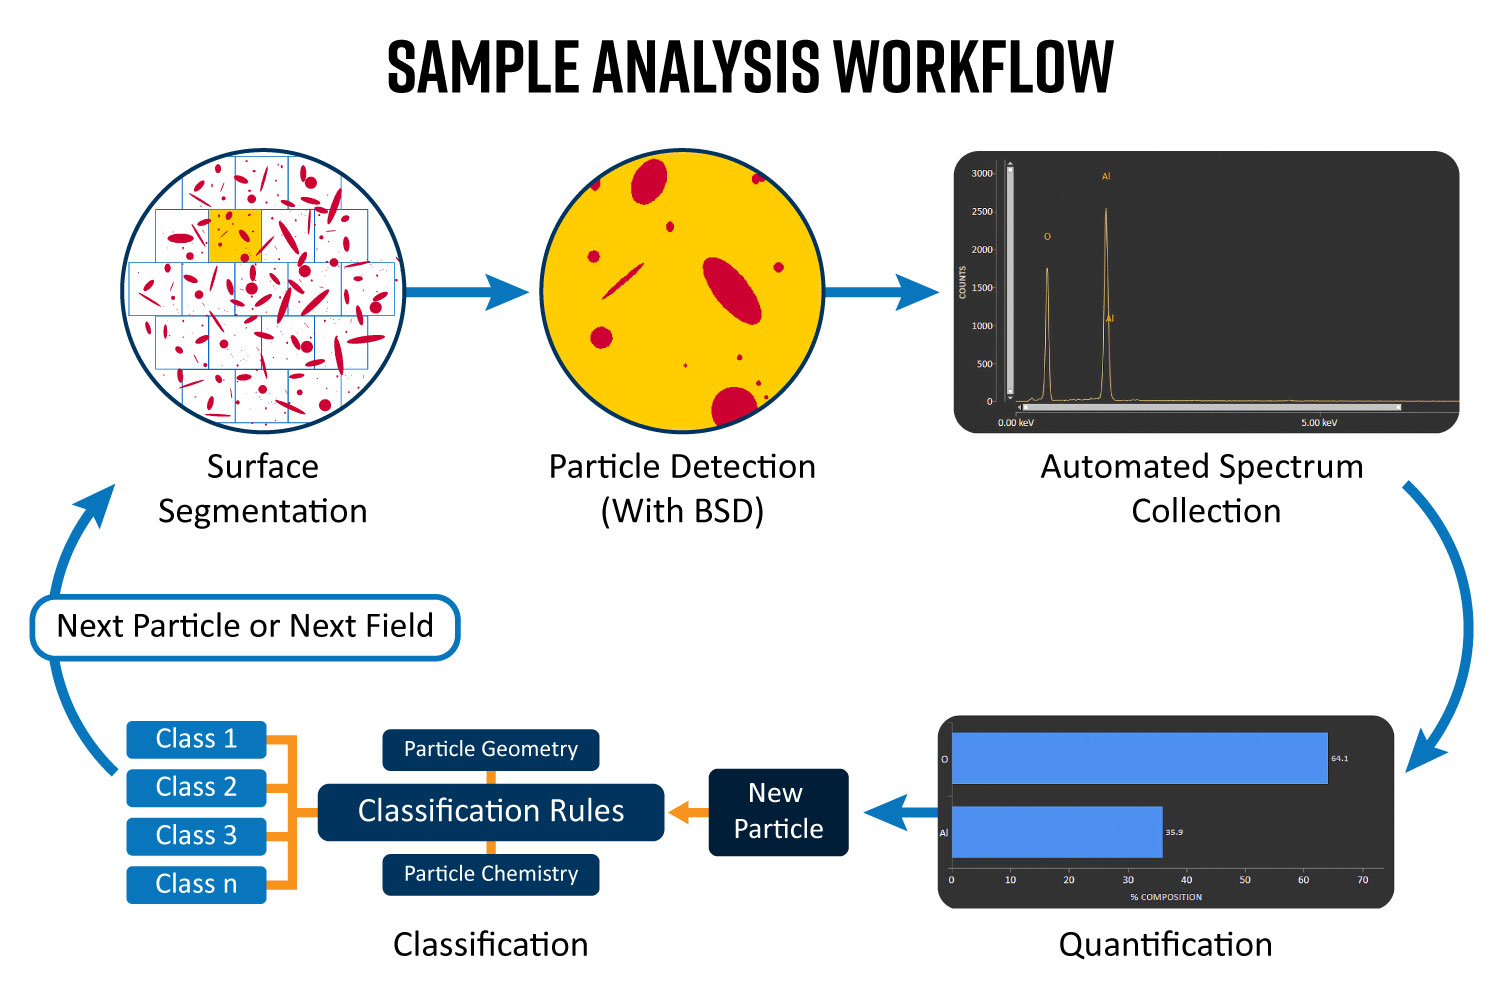
Perception software for the Phenom XL Desktop SEM, performs a detailed scan of the sample area, frame by frame, using the backscattered electron (BSD) detector to identify particles based on contrast. Once detected, the particle size is measured at high magnification and immediately analyzed using EDS. Every particle is assigned a set of data, including morphology (size, shape) and elemental composition, which is stored in a searchable database for easy review. The complete workflow is represented in Figure 6.
Figure 6. Perception workflow: The sample area is divided into tiles, where individual images are captured using a backscattered electron detector. Particles are identified based on intensity thresholds, followed by EDS spectrum acquisition and size and shape analysis. Each particle is then classified according to user-defined rules, using EDS quantification and size measurements.
Automated Reporting with Perception Reporter
ParticleX TC is the dedicated reporting module within Perception, delivering complete cleanliness reports aligned with ISO 16232/VDA 19 standards. The data can be normalized based on the surface area or volume of the washed part, and include cleanliness codes, particle counts, and pass/fail results based on user-defined specifications.
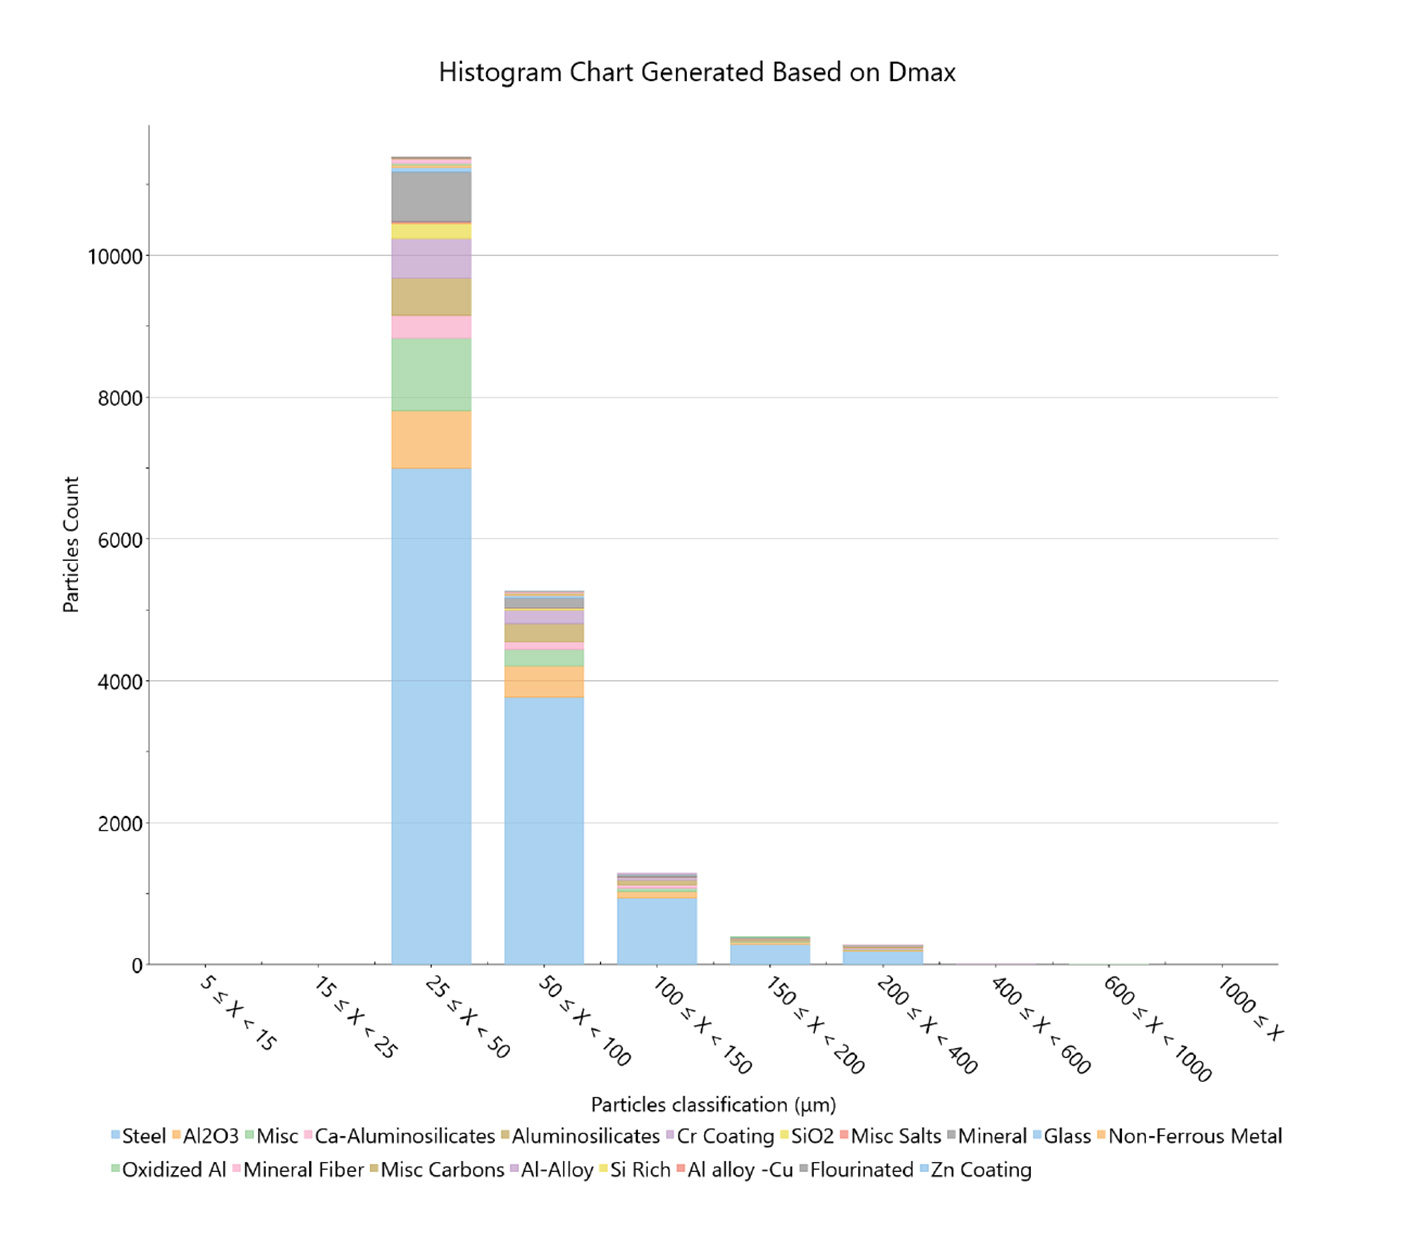
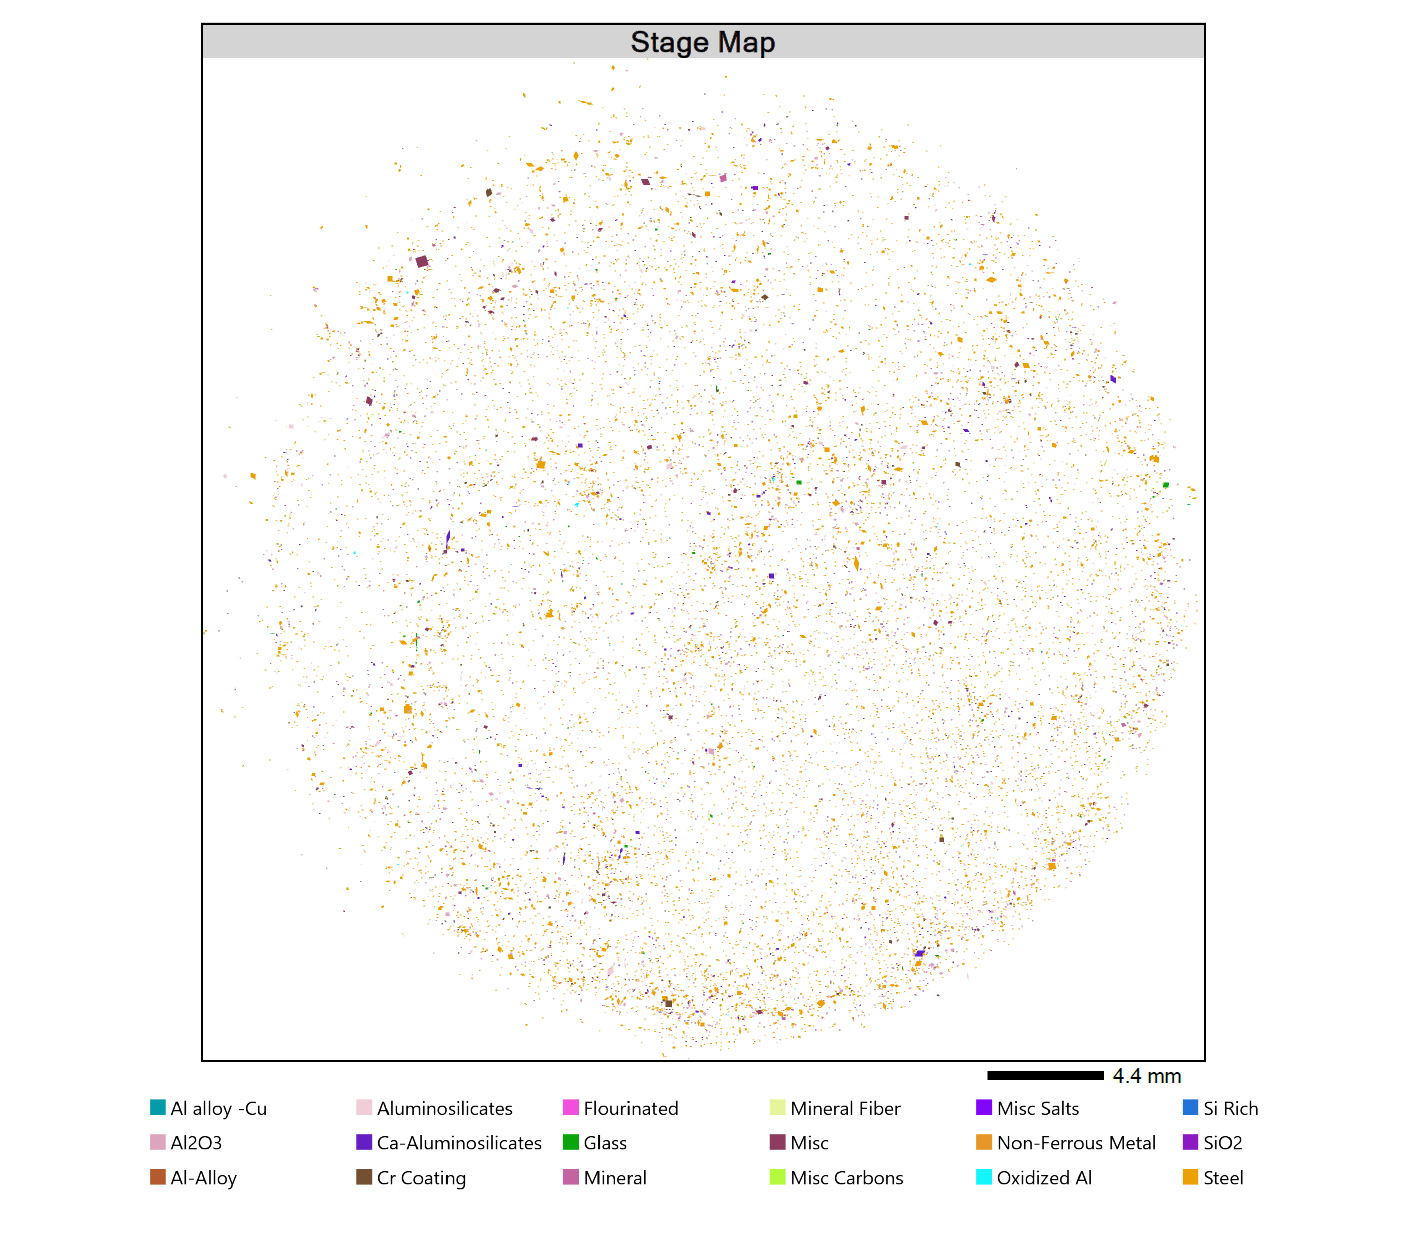
Reports can include average elemental compositions, summary tables containing statistical data on particle characteristics, and visualization tools like histograms and stage maps (Figure 7), all automatically compiled and formatted. The report generation system is integrated directly into the analysis workflow, meaning a standardized report is generated immediately once the analysis completes. This results in minimized turnaround time and human error.
a
b
Figure 7. Ways to visualize particle data in ParticleX TC reporter: (a) histogram chart based on particle diameter (Dmax) and (b) a stage map showing the location, relative size, and classification of every detected particle.
Hardness and Conductivity Classification
Perception also integrates hardness and conductivity ratings to aid in rapid particle risk assessment. Materials are categorized using rounded Mohs hardness values or relative conductivity, allowing users to sort particles by their potential to damage components.
Potentially dangerous particles identified as hard or conductive are then highlighted in red and listed first to help users focus on critical contaminants. Custom CCC codes or particle-specific limits can also be defined to align with internal specifications or customer requirements.
Key Takeaways
SEM/EDS offers a much deeper level of analysis by identifying the material composition of each particle, which is not always required by public standards, but is highly beneficial when root cause analysis or process improvement is the goal. While standards may focus on particle size and quantity, understanding what the particles are made of provides critical insight into where they originate and how they can be eliminated.
As demonstrated by the included examples, visually ambiguous particles can be misclassified or entirely missed using optical methods. SEM imaging with backscattered electron detection contrasts particles of different atomic weights making contaminants clearer in the image. Using EDS provides definitive elemental composition of the sample or particle of interest. These capabilities are particularly vital when identifying killer particles such as abrasives or metallic debris that introduce risks of failure to the system.
With automated SEM/EDS enabled by Perception software with automated reporting through ParticleX TC, manufacturers gain the resolution, sensitivity, and specificity needed to detect these high-risk particles, trace their source, and implement effective corrective actions. This ultimately supports higher reliability, quality, and compliance in critical applications.
References
Valizade, N.; Farhat, Z. A review on Abrasive wear of Aluminum Composites: Mechanisms and influencing factors. Journal of Composites Science2024, 8 (4), 149. https://doi.org/10.3390/jcs8040149.
Saini, S.; Shah, J. M.; Shahi, P.; Bansode, P.; Agonafer, D.; Singh, P.; Schmidt, R.; Kaler, M. Effects of gaseous and particulate Contaminants on Information Technology Equipment Reliability—A Review. Journal of Electronic Packaging 2021, 144 (3). https://doi.org/10.1115/1.4051255.
Raţiu, S.; Josan, A.; Alexa, V.; Cioată, V. G.; Kiss, I. Impact of contaminants on engine oil: a review. Journal of Physics Conference Series 2021, 1781 (1), 012051. https://doi.org/10.1088/1742-6596/1781/1/012051.
Download the Tech note:
Questions about this tech note? Send us a message!