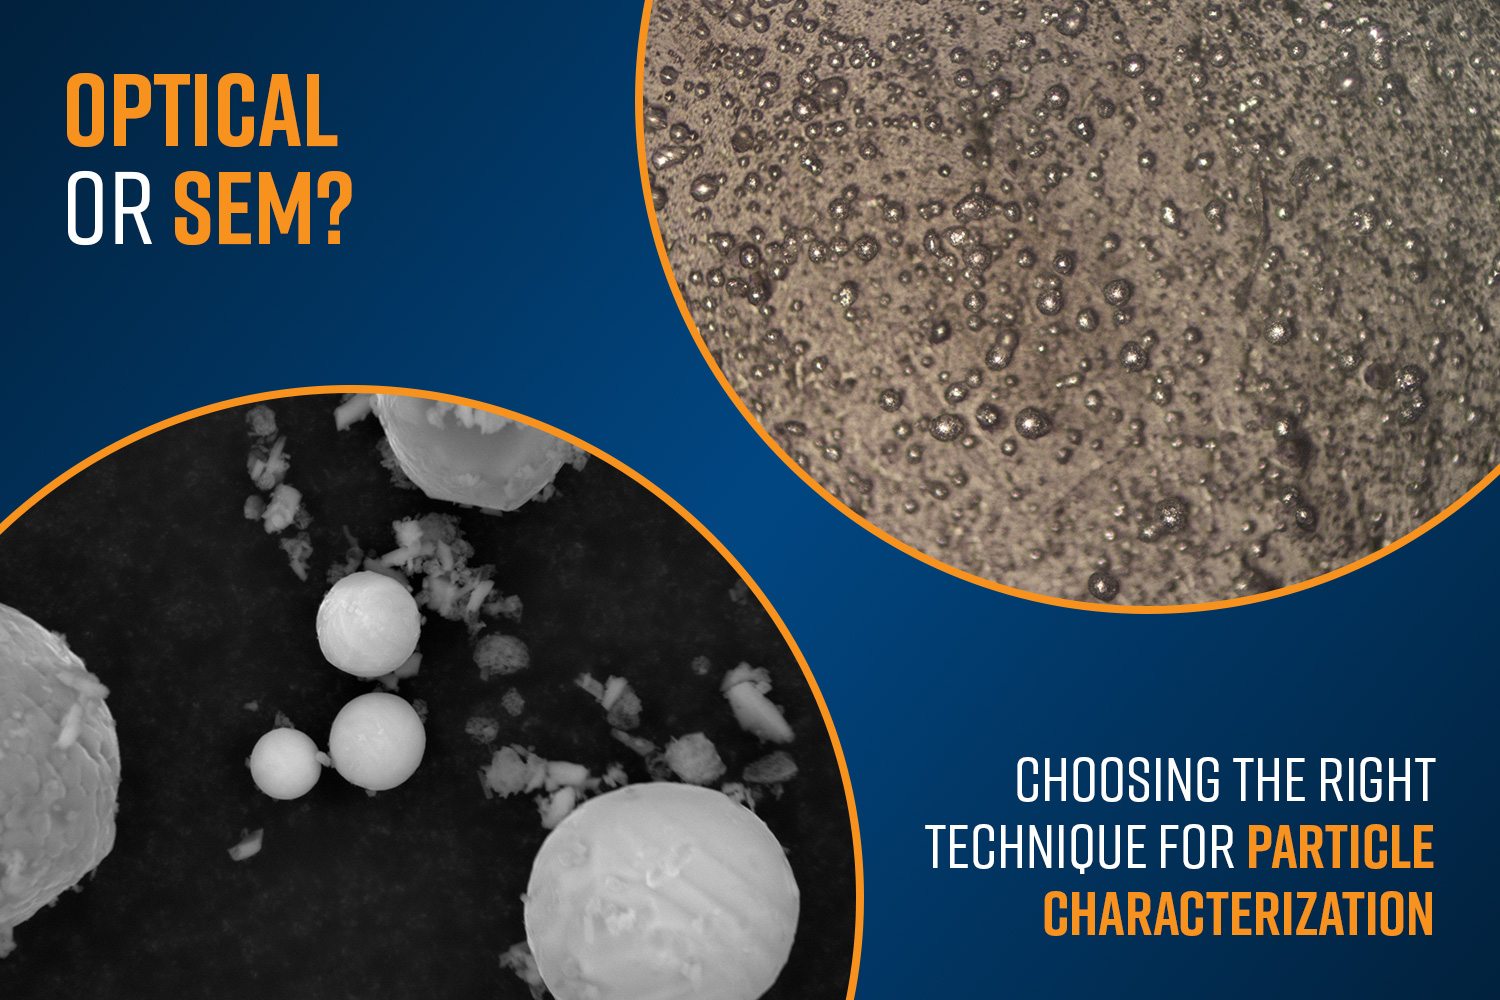
Particle analysis, which typically focuses on parameters such as size, shape, distribution, concentration, and composition, plays a critical role across a wide range of industries, from pharmaceuticals and biotechnology to advanced manufacturing and materials engineering.1,2 Two primary methods are commonly used to analyze particles: optical methods and scanning electron microscopy (SEM). While both aim to quantify size distributions and morphology, they differ in resolution, sample preparation, throughput, cost, and the depth of information obtained. This article provides an overview of how each technique works, the strength and weakness of each and when they are best used for particle characterization.

Optical Techniques for Particle Analysis
There are two major optical techniques for particle analysis:
Laser Diffraction & Light Scattering (LD, DLS)
LD & DLS infer particle size from the scattering of an incident laser beam by a population of particles. Laser diffraction methods typically can analyze particles in ~0.1 µm – 3 mm range and provide information about the volume-weighted size distribution. Dynamic Light Scattering (DLS) analyzes particles in the ~0.3 nm – 1 µm range and provide information regarding the hydrodynamic diameter & polydispersity. The conversion from scattering pattern to size assumes that the particles are spherical. Non-spherical particles can skew results.
Bright-field Optical Microscopy & Dynamic Image Analysis
These techniques capture images of the particles and extract information regarding the concentration, shape and size of the particles using automated algorithms. They are commonly used to analyze particles ≥1 µm.
The optical techniques are generally fast and require minimal sample preparation. Measurements can be made in air, liquid, or dry dispersions. However, the resolution of these techniques is diffraction-limited that restrict visualization of fine surface features. Also, these techniques do not provide any information regarding the elemental composition of the particles.
SEM for Particle Analysis
Scanning electron microscopes raster scan a focused electron beam over the specimen in vacuum. Secondary or backscattered electrons from the interaction with the samples generate grayscale images with nanometer-scale resolution. Elemental composition of the particles can be elucidated by pairing the SEM with energy-dispersive X-ray spectroscopy (EDS) detector. SEM techniques can routinely analyze spherical and irregular shaped particles, down to ~10 nm. SEM-EDS can correlate morphology to elemental composition of the particle which can be critical for root-cause analysis of contaminants, inclusions, or wear particles.
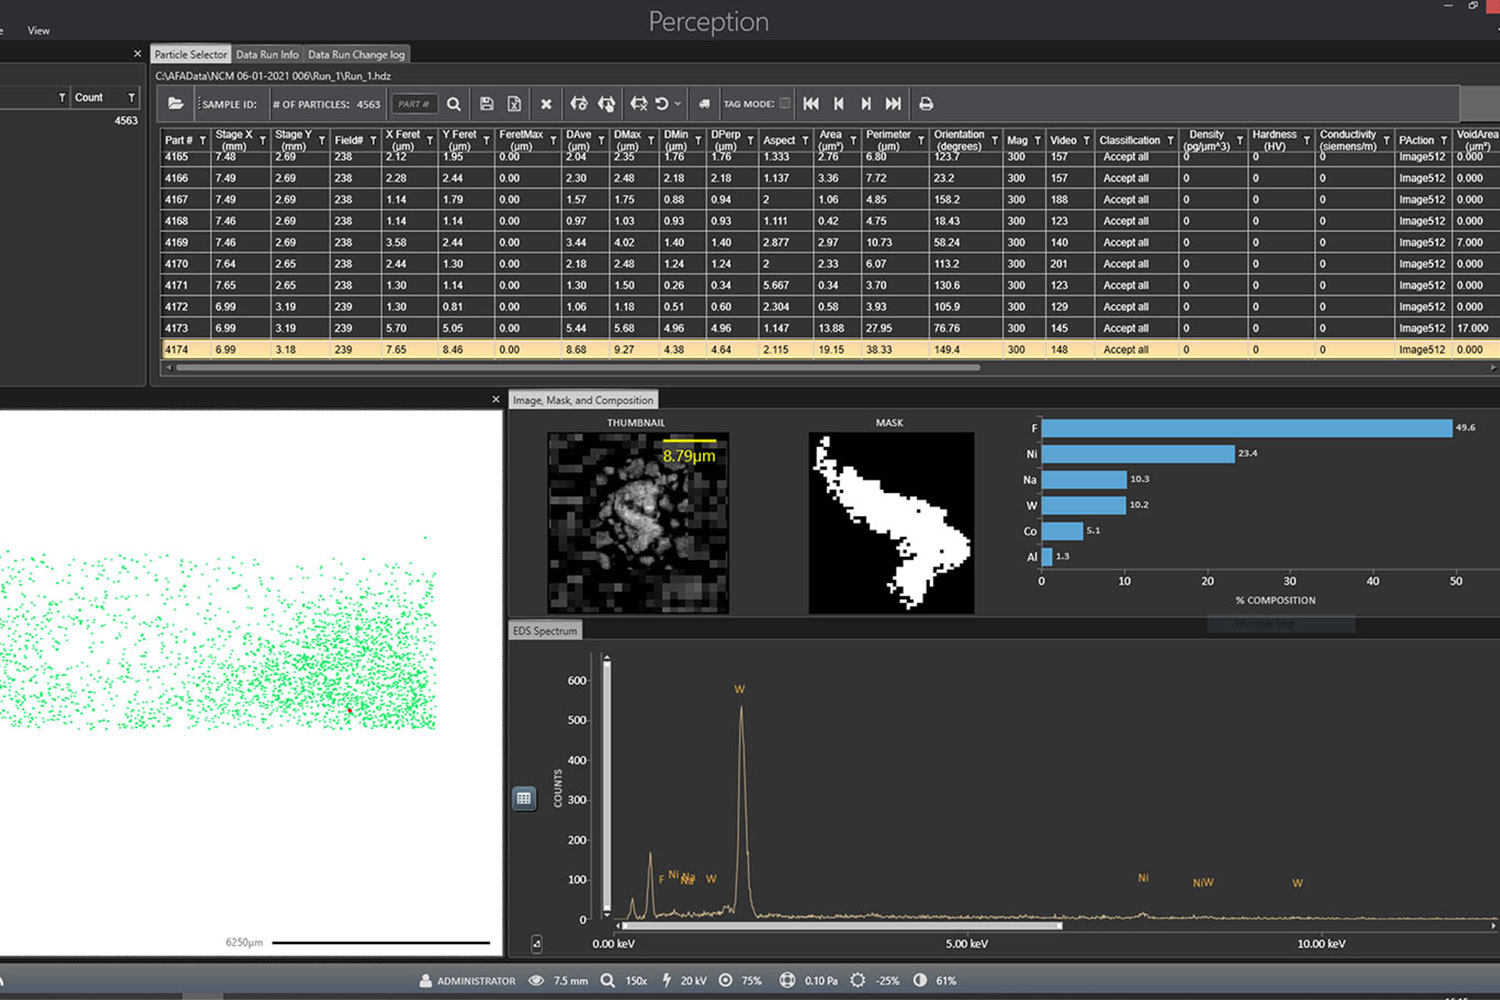
Classical SEM workflows involved an operator manually selecting the fields of view, collecting data and analyzing the particles. This method was laborious and prone to user errors. Automated SEM platforms integrate motorized stages, auto focus, particle-finding algorithms, and batch EDS analysis. Systems such as ParticleX (Figure 1) can routinely analyze 40,000+ particles per hour with unattended operation, producing statistically robust datasets that include size, shape, and composition.
However, even with automation, SEM is slower than optical methods and has a lower throughput. Samples can only be analyzed in vacuum and extensive sample preparation might be required.
| Optical Methods | SEM Methods | |
| Smallest practical particle | ≈0.2 µm (optical limit) | <10 nm |
| Shape fidelity | Limited (LD/DLS assume spheres) | True 3-D surface |
| Elemental info | None | SEM-EDS gives elemental spectra |
| Sample environment | Ambient or liquid | Vacuum |
| Analysis speed (10³ – 10⁴ particles) | Seconds to minutes | Minutes with automated SEM |
| CapEx | Lower | Higher |
Choosing the Right Technique
Optical particle analysis remains the fastest, most economical path for routine size measurements above the optical diffraction limit. Scattering techniques (LD, DLS) and dynamic imaging deliver statistically robust distributions with minimal sample prep, but they cannot resolve fine surface features or provide elemental data. SEM, particularly with modern automation, excels where nanoscale morphology and chemical insight are critical.
Application Scenarios Where Optical Methods Are Preferred:
Optical methods are ideal when analyzing spherical particles that are larger than 0.5 µm in size and the compositional information of the particles is not critical.
Laser diffraction (LD) and dynamic light scattering (DLS) offer rapid, repeatable size distribution measurements and are ideal for routine, high-throughput quality analysis of powders and slurries in manufacturing settings. Specific examples include particle size monitoring in cement, pigments, or ceramic powders, emulsion and suspension stability in paints and checks of API (active pharmaceutical ingredient) crystallization process.
Optical methods are preferred in real-time process monitoring where inline sensors based on light scattering or image analysis provide near-instantaneous feedback for process control loops. Optical sensors are commonly used in monitoring agglomeration in wastewater treatment, and spray drying optimization. In applications involving formulation screening, such as pigment dispersion in inks and coatings and stability of nanoparticles, the quick feedback provided by optical methods on how particle sizes change with processing conditions, are beneficial in optimizing formulations.
Dynamic light scattering techniques are used to characterize nanoparticle suspensions or protein aggregates in solutions. DLS provides hydrodynamic diameter and polydispersity index, a key to predicting colloidal stability and is especially applicable to characterization of liposome or micelle in drug delivery, nanoparticle suspensions and antibody aggregation.
Application Scenarios Where SEM Methods Are Preferred
When nanometer-scale resolution is required, irregular particle morphologies are involved, or chemical identity information (via EDS) is required, SEM techniques are preferred.
SEM based particle analysis techniques are preferred in failure analysis and root cause investigations since high resolution data and elemental contrast are critical when identifying rare defects or unknown contaminants. Specific examples include detection and identification of foreign particulate matter in injectable pharmaceuticals, abrasive wear particles in lubricants and inclusion defects in semiconductor wafers or optical components.
Automated SEM with EDS can characterize size, shape, and composition of metallic, organic, and inorganic particles on filters or surfaces. This ability is critical for Technical Cleanliness and contamination control in automotive, aerospace, and medical devices industries. Cleanliness testing of components (ISO 16232 or VDA 19 standards), particle analysis on hard disk drives and surgical implants are a few of the key applications of particle analysis by SEM.
SEM methods are preferred in advanced research and development, where nanoscale features and surface textures are important. Applications involving battery electrode powder characterization, catalyst particle porosity and dispersion and additive manufacturing powder sphericity are few of the key areas where SEM methods have a definite advantage over optical methods.
| Application Area | Preferred Method | Reason |
| Routine QC (≥1 µm, high throughput) | Optical (LD, DIA) | Speed, cost, ease of use |
| Submicron size in suspension | Optical (DLS) | Non-destructive, fast sizing |
| Rare/unknown particle ID | SEM-EDS | High-resolution + elemental analysis |
| Technical cleanliness (ISO/VDA) | SEM (automated) | Composition + shape classification |
| Nanomaterials and research | SEM | True shape & fine surface details |
| Inline process control | Optical | Real-time capability |
| Formulation screening | Optical | Rapid size metrics across large batches |
| Wear/debris analysis | SEM | 3D morphology + elemental composition |
Conclusion
Optical and SEM-based particle analysis methods each have distinct strengths and selecting the right tool depends on the specific analytical goals. Optical techniques are ideal for rapid, high-throughput size measurements, especially when particles are relatively large and spherical. They are cost-effective, easy to operate, and well-suited for routine quality control and process monitoring. Scanning electron microscopy (SEM) excels in applications that demand high-resolution imaging, detailed morphology, and chemical composition analysis.3
Rather than choosing one technique over the other, many laboratories integrate optical methods for speed and SEM for depth into a complementary workflow. Integrating rapid optical screening with targeted, information-rich SEM-EDS analysis, enables teams to make faster, more informed decisions about materials, quality, and performance. Ultimately, aligning the particle analysis strategy with the capabilities of each method ensures more reliable results and a better understanding of the particles.
References
- Maguire, C. M.; Rösslein, M.; Wick, P.; Prina-Mello, A. Characterisation of particles in solution – a perspective on light scattering and comparative technologies. Science and Technology of Advanced Materials 2018, 19 (1), 732–745. https://doi.org/10.1080/14686996.2018.1517587. ↩︎
- Van Der Pol, E.; Hoekstra, A. G.; Sturk, A.; Otto, C.; Van Leeuwen, T. G.; Nieuwland, R. Optical and non‐optical methods for detection and characterization of microparticles and exosomes. Journal of Thrombosis and Haemostasis 2010, 8 (12), 2596–2607. https://doi.org/10.1111/j.1538-7836.2010.04074.x. ↩︎
- Tiwari, A.; Pandey, M.; Tirkey, A.; Tiwari, A.; Dubey, R.; Pandey, S. K. Image based analytical approaches for study of particulate matter (PM) in air. Frontiers in Environmental Science 2024, 12. https://doi.org/10.3389/fenvs.2024.1362422. ↩︎