Table of Contents
What is surface tension?
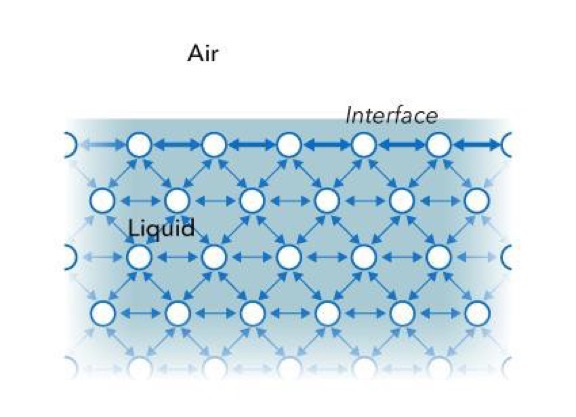
All liquids – water, organic solvents, oils, and so on – have strong intermolecular cohesive forces. Molecules in the bulk experience this attractive force in all directions. However, liquid molecules at the surface formed between the liquid and a gas, such as air, do not have neighbors of the same kind on all sides like in Figure 1. Molecules at the surface experience a net attractive force towards the bulk of the liquid, resulting in a surface “film” that makes it more difficult to move an object through that surface than through the bulk. This “film” acts like an elastic membrane with a tension force acting in all directions along the surface, i.e. surface tension.
What is interfacial tension?
When an interface forms between two immiscible liquids or two dissimilar phases, a similar situation occurs. In this case it is called interfacial tension. However, at a gas-liquid interface, it is called surface tension, and at a gas-solid interface, it is called surface free energy.
How are surface and interfacial tension interpreted?
Surface and interfacial tension are typically represented by the lowercase Greek letter gamma, γ (sigma, σ, is also sometimes used). Several units are traditionally used, the most common being mN/m or the equivalent dyn/cm, which have dimensions force/length. Sometimes the equivalent unit mJ/m2 is used, which has dimensions of energy/area. Thus, surface and interfacial tension can be interpreted in two ways: as a tension force acting along all directions of the surface per unit length, or as the energy required to increase the surface area. In both interpretations, the surface wants to minimize its surface area or potential energy. Therefore, a surface with no (or negligible) external forces will form a sphere which has the smallest surface area to volume ratio.

How are surface and interfacial tension measured?
Techniques to measure surface and interfacial tension are separated here into two main categories: force tensiometry where the force the surface imparts on a probe is directly measured; and optical tensiometry where the profile of a drop or bubble extracted from an image is fit to a theoretical equation.
Force tensiometry
In force tensiometry, the force experienced by a probe at the liquid surface is directly measured. The three most common techniques for making these measurements are: the Du Nouy ring method, the Wilhelmy plate method, and the platinum rod. In each technique, the respective probe is hung from a sensitive balance while being brought in contact with the liquid. The size and shape of the probe, contact angle between the probe and liquid, and in some cases liquid density, are incorporated into models to relate the measured force to surface or interfacial tension. To simplify the model, employing platinum/iridium alloy probes is useful because they have a high surface energy and allow the contact angle to go to zero.
How are surface and interfacial tension measured using the Du Nouy ring method?
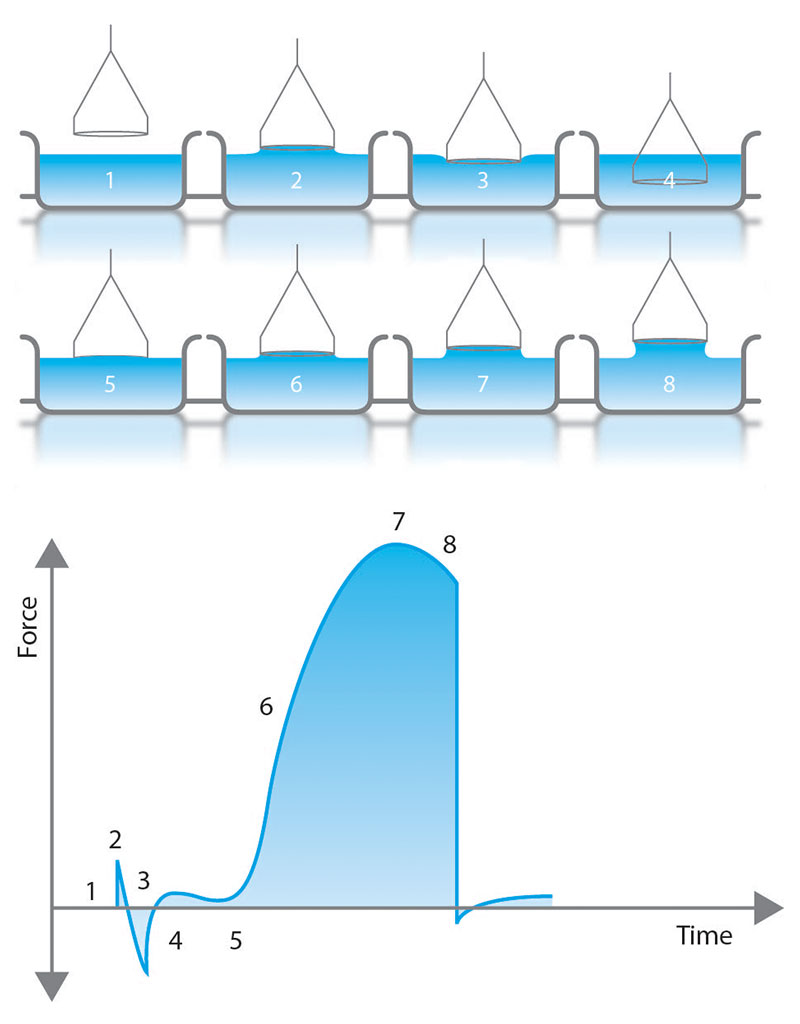
The Du Nouy ring method brings a platinum ring in contact with the surface or interface [1]. First, the ring is fully submerged and then slowly lifted up to form a meniscus-like in Figure 2. During this process, the force of the meniscus pulling on the ring is measured with the balance as shown in the plot in Figure 2. Prior to the meniscus tearing, the meniscus will exert a maximum force (point 7 in Figure 2). With modern force tensiometers, software programs use this measured maximum force to determine the surface tension. While the original theory assumed a ring with infinite diameter and neglected excess liquid pulled up in the circular meniscus, current methods include correction factors in software calculations [2,3]. These correction factors require the liquid density to be known.
How are surface and interfacial tension measured using the Wilhelmy plate?
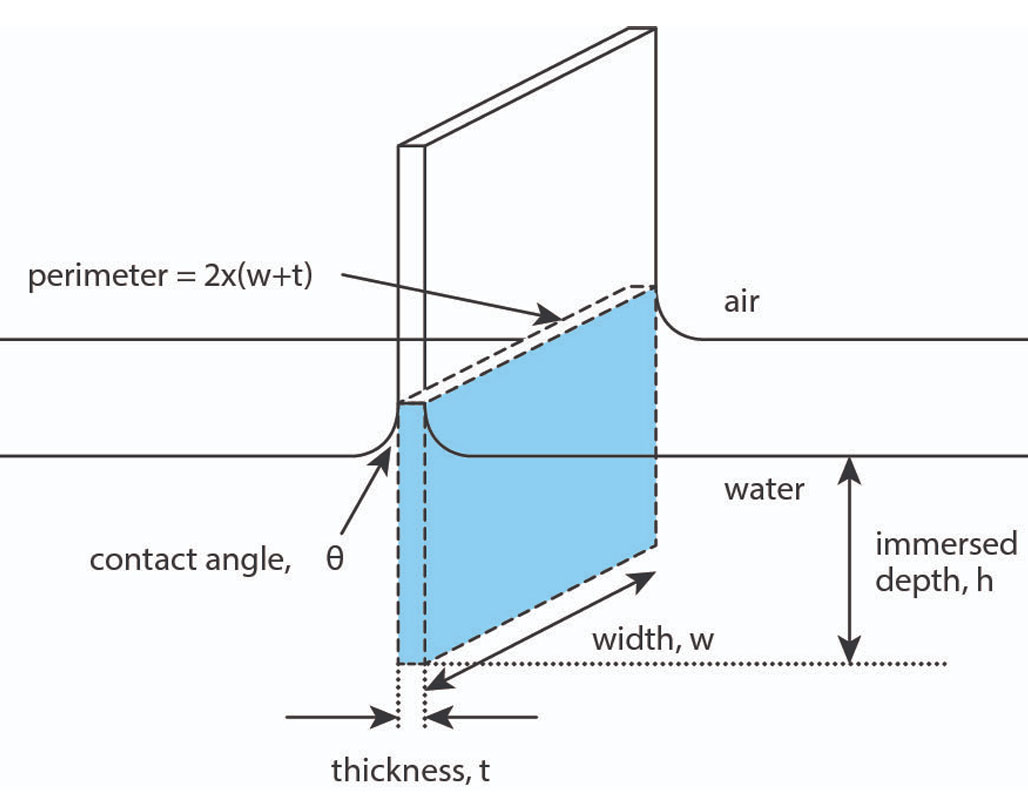
The Wilhelmy plate method brings a platinum plate into contact with the surface as in Figure 3 [4]. In this case, the model assumes the plate is fully wetted and the plate is in contact with, but not submerged in, the liquid. Therefore, the position of the plate relative to the surface is critical. As the plate is lowered and brought into contact with the liquid, this “zero depth of immersion” height is recorded. The plate is then completely lowered into the liquid and raised back to the zero depth of immersion. At this point the force recorded by the balance is used to determine the surface tension according to the equation:
ΔF = 2γ(t + w)
Equation 1
where ΔF is the net wetting force, 2(t + w) is the wetted perimeter of the probe, and γ is the surface tension. Note that the contact angle between the plate and the liquid is assumed to be zero. In contrast to the Du Nouy ring method, the density of the liquid is not necessary to measure surface tension.
How is surface tension measured using a platinum rod?
The “platinum rod” technique of measuring surface tension at an air-liquid interface was first introduced by Padday et. al. in 1974 [12]. Commonly referred to as the du Nouy—Padday method, this technique uses a platinum rod as the force probe instead of the platinum ring that is typically used in the du Nouy method. Padday found that if the rod is oriented vertically, perpendicular to the air-liquid interface, the maximum force exerted on the rod at equilibrium, while supporting a meniscus of liquid at the free surface of said liquid, is a characteristic property of the system [12]. Thanks to this simplification, surface tension can be derived from the measured rod radius and the maximum force.
This method helps overcome some logistical challenges related to similar measurement methods, such as allowing the determination of surface tension using significantly less liquid than is necessary for the du Nouy ring method. In a typical du Nouy ring measurement, there must be enough liquid to fill a vessel that is large enough for the platinum ring to be lowered into the liquid, and the probe must be able to fully wet in the vessel. When using a rod instead of a ring, the volume of liquid can be much smaller.
There are tradeoffs for using the du Nouy—Padday method, such as loss of accuracy. Padday stated that the method is only believed to be accurate to +/-0.1 mN/m. However, to its benefit, it does not require additional end corrections because it is an absolute method [12]. Another limitation of the Padday method is that the rod radius must not be too large compared to the liquid vessel used. If the probe is too close to the sides of the liquid vessel, a liquid meniscus can form against the edge of the vessel, skewing the maximum force measurement. It is typically recommended to ensure that there is at least 2mm of space between the rod and vessel sidewall throughout the experiment.
How are surface and interfacial tension measured using optical tensiometry?
Optical tensiometry uses drop or bubble profiles to indirectly measure surface and interfacial tension. In the literature, this technique is commonly referred to as axisymmetric drop shape analysis or ADSA [5]. ADSA can be subdivided into pendant drops/bubbles where a drop or bubble is suspended from a needle or pipette tip; sessile drops where a drop rests on a solid surface; and liquid bridges where a drop is attached to two independent surfaces such as a needle above and a solid surface below. Perhaps the most common optical tensiometry technique for measuring surface tension is the pendant drop/bubble method.
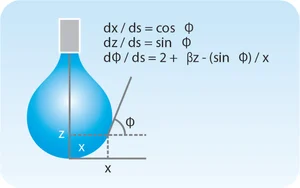
The theoretical foundation of the pendant drop/bubble method was described by Bashforth and Adams in 1883 [6]. The technique revolves around extracting a drop or bubble shape from the Young-Laplace equation:
Δρgz = -γκ
Equation 2
where Δρ is the difference in density between the drop/bubble phase and the continuous (surrounding) phase, g is gravitational acceleration, z is the vertical distance from the drop/bubble apex (Fig. 4), γ is the surface or interfacial tension, and κ is the curvature. Equation 2 describes the balance between gravity pulling the drop down in Figure 4 (left-hand side of Equation 2) and surface tension resisting this pull (right-hand side). Discretizing with respect to arc length along the drop surface, s, leads to three dimensionless coupled differential equations shown in Figure 4 [7] that are solved numerically. In modern tensiometers, these first-order equations are solved by advanced software programs such as OneAttension.
Effects of Temperature and Pressure on Surface and Interfacial Tension
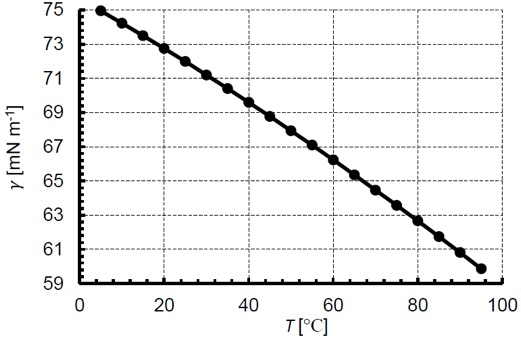
Surface and interfacial tension are sensitive to temperature and pressure. In the case of temperature, surface tension has been shown experimentally to decrease nearly linearly with temperature. The increase in temperature causes a corresponding decrease in cohesive intermolecular forces and this surface tension decreases. For example, the surface tension of water and air is 72.8 mN/m at 20°C, while the surface tension at 25°C is 72.0 mN/m. Figure 5 plots the surface tension of water and air for a range of temperatures from ref. [9]. As for pressure, surface tension is relatively unaffected by pressure changes until reaching high pressures as would be found in enhanced oil recovery and supercritical fluids. The increasing pressure causes dissolution of gas in the liquid, thereby decreasing the surface tension.
Standards Related to Surface and Interfacial Tension
Surface and Interfacial tension are the basis of several regulatory standards, including ISO, ASTM, and others. These standards provide detailed and specific protocols for the assessment of surface tension and interfacial tension as they relate to industrial processes. Detailed descriptions of each relevant standard are available at the link from Biolin Scientific below
References
[1] P.L. du Noüy. A new apparatus for measuring surface tension. J. Gen. Physiol 1 (1919) p. 521-524.
[2] C. Huh, S.G. Mason. A rigorous theory of ring tensiometry. Colloid Polymer Sci. 253 (1975) p. 566-580
[3] H.H. Zuidema, G.W. Waters. Ring method for the determination of interfacial tension. Ind. Eng. Chem., Anal. Ed. 13 (1941) p. 312-313
[4] A.W Neumann, R.J. Good, R.R. Stromberg. Surface and Colloid Science, Vol. 11, pp. 31-91. Plenum Press, New York, NY (1979).
[5] S.M.I. Saad, A.W. Neumann. Axisymmetric Drop Shape Analysis (ADSA): An Outline. Adv. Colloid Interface Sci. 238 (2016) pp. 62-87
[6] F. Bashforth, J.C. Adams, An attempt to test the theories of capillary action. Cambridge University Press. London, England, 1883.
[7] Y. Rotenberg, L. Borkuva, A.W. Neumann. Determination of surface tension and contact angles from the shapes of axisymmetric fluid interfaces. J. Colloid Interface Sci. 93 (1983) p. 169-183.
[8] N.J. Alvarez, L.M. Walker, S.L. Anna. A non-gradient based algorithm for the determination of surface tension from a pendant drop: Application to low Bond number drops. J. Colloid Interface Sci. 333 (2009) pp. 557-562
[9] N.B. Vargaftik, B.N. Volkov, L.D. Voljak. International tables of the surface tension of water. J. Phys. Chem. Ref. Data 12 (1983) p. 817-820.
[10] A.J. Prosser, E.I. Franses. Adsorption and surface tension of ionic surfactants at the air-water interface: review and evaluation of equilibrium models. Colloids Surf. A 178 (2001) p. 1-40.
[11] C.-T. Hsu, M.-J. Shao, S.-Y. Lin. Adsorption kinetics of C12E4 at the air-water interface: adsorption onto a fresh interface. Langmuir 16 (2000) p. 3187-3194.
[12] Padday, J. F., A. R. Pitt, and R. M. Pashley. “Menisci at a Free Liquid Surface: Surface Tension from the Maximum Pull on a Rod.” Journal of the Chemical Society, Faraday Transactions 1: Physical Chemistry in Condensed Phases 71, no. 0 (1975): 1919. https://doi.org/10.1039/f19757101919.