Particle Analysis and characterization with the Scanning Electron Microscope (SEM)
Understanding the physical characteristics of particles in dry powder materials is an essential aspect of drug product development. The particle size distribution of either active pharmaceutical ingredients (APIs) of excipients often has a significant impact on product performance and manufacturability. Increasingly, scanning electron microscopy is being employed in order to investigate particle size, morphology and chemical composition.
The Phenom Desktop SEM includes several features that make it a natural choice for the investigation of pharmaceutical particles:
- Back-scatter electron detection coupled with automated image acquisition allows for extremely high-throughput data acquisition and quantitative particle sizing based on the BSE signal.
- The high-brightness Cerium Hexaboride source produces unparalleled image quality while maintaining an extremely long lifetime.
- The integrated EDS detector with mapping enables quick determination of particle composition.
Two types of detectors are routinely used to generate SEM images: back-scatter electron (BSE) detectors and secondary electron (SE) detectors. The key benefit of BSE detectors for this application is that particles of the differing average atomic number will exhibit different brightness in the generated images. This enables the unambiguous determination of individual and bulk particle characteristics from mixtures of different particles such as excipient blends.
Automated Particle Characterization of an Excipient Blend
The Phenom SEM was programmed to automatically acquire a mosaic of images and then identify and measure each individual particle using the Particlemetric software. The image below was originally acquired over a 5.3 x 3.6 mm area with a pixel resolution of 500 nm.

Quantitative image processing to measure particle size distributions
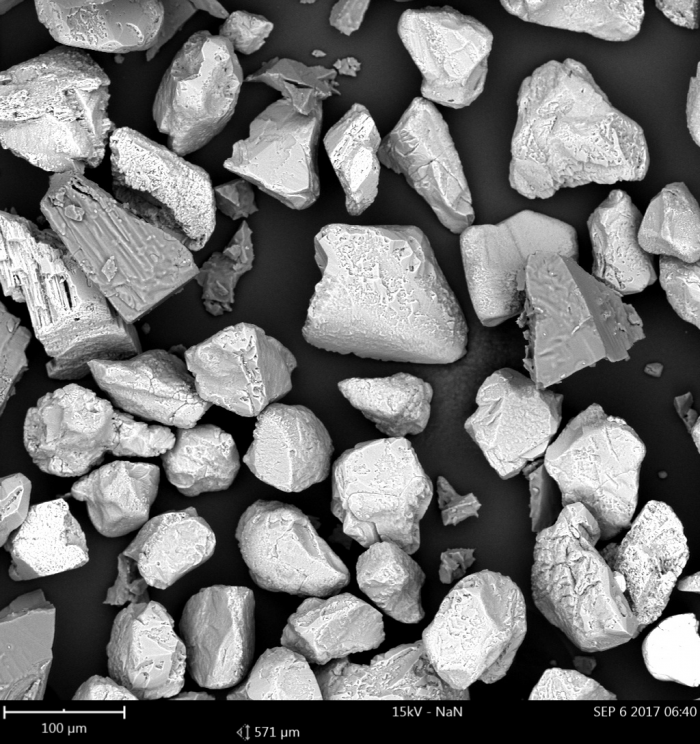
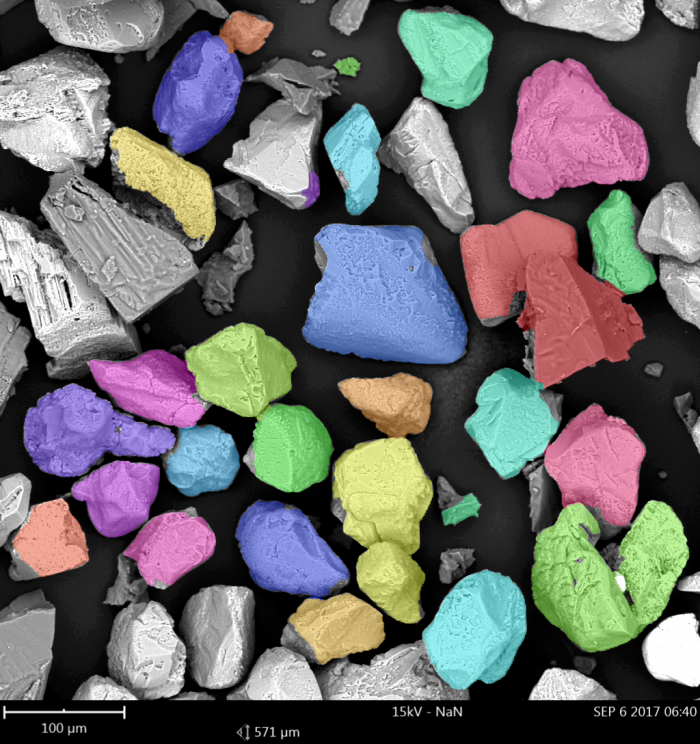

Segregation of differing materials by grayscale and plotting of key characteristics can then be completed. The darker gray particles as seen in the above image have a broad size distribution with an average circle equivalent diameter of 35 ± 31 µm. The lighter particles are much more tightly constrained with an average circle equivalent diameter of 80 ± 31 µm. The total time required to complete this automated acquisition with post-processing was under 20 minutes, over 3,000 particles were identified and measured.