What is Quartz Crystal Microbalance (QCM) Technology?
Quartz Crystal Microbalance with Dissipation Monitoring (QCM-D) is a powerful analytical technique used to study nanoscale surface interactions in real-time and label-free. By detecting mass shifts as molecules attach to or detach from the sensor surface, QCM-D tracks subtle changes in molecular interactions. It simultaneously measures energy dissipation, distinguishing between soft and rigid materials based on their viscoelastic properties. The technique works by applying an alternating current (AC) to a piezoelectric quartz crystal disc, inducing oscillations at a resonant frequency. As mass accumulates or is removed from the surface, the crystal’s resonant frequency and energy dissipation change. These combined measurements make QCM-D an essential tool for studying complex systems such as proteins, polymers, and biomolecular assemblies.
Fundamentals of Quartz Crystal Microbalance
Quartz & Piezoelectricity
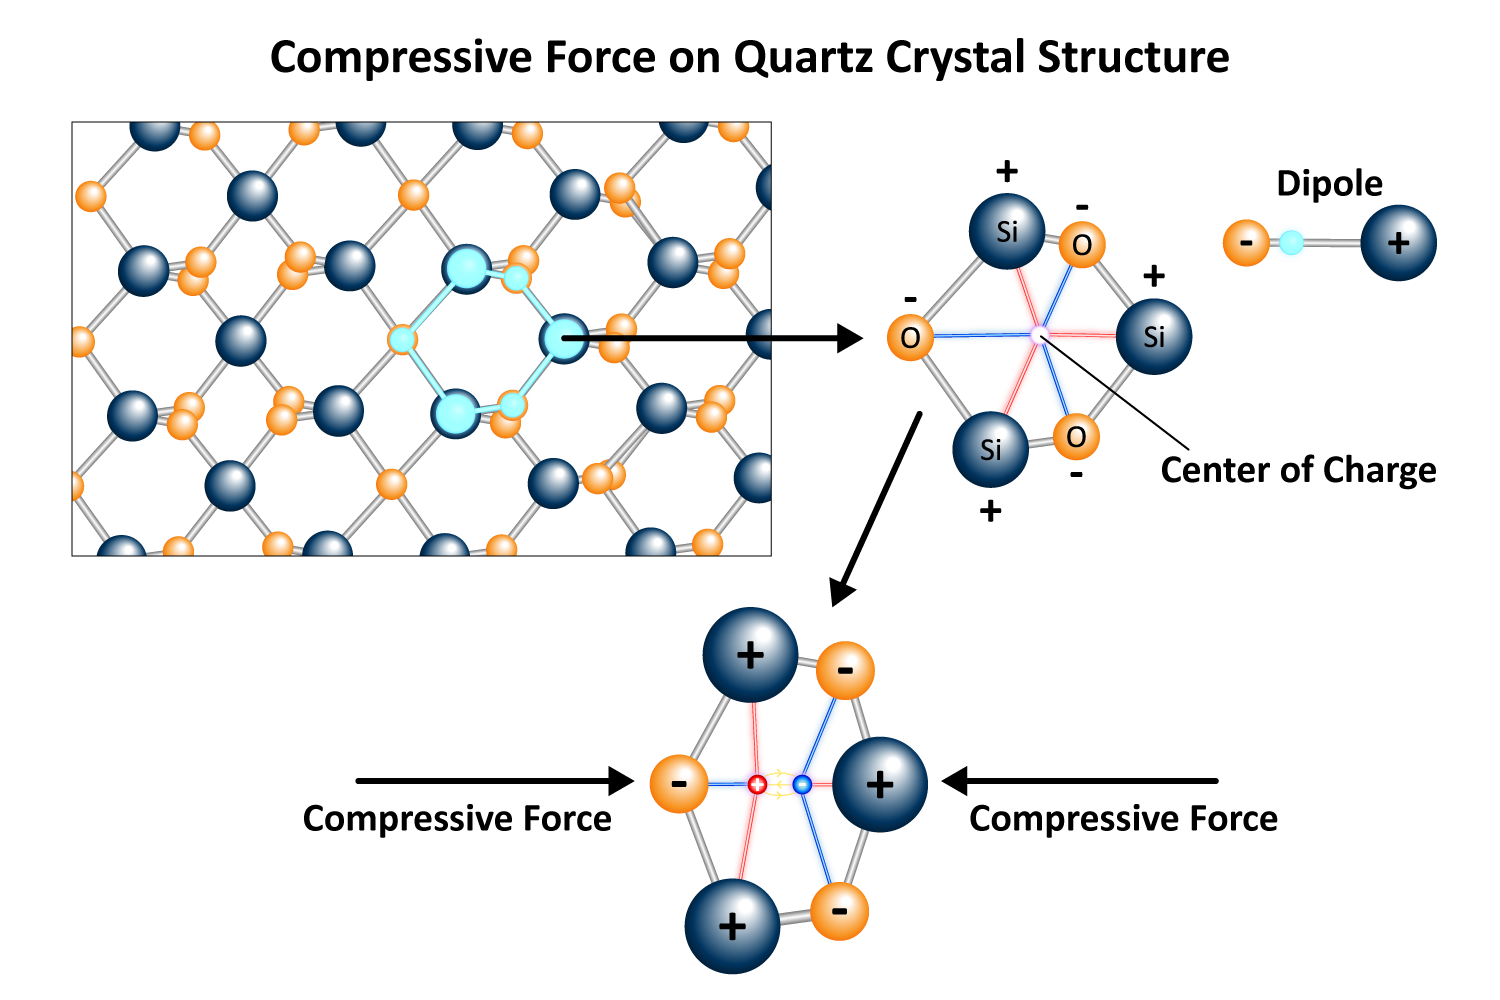
Quartz is an extraordinary material known for its piezoelectric properties, generating an electrical charge when mechanically stressed and deforming mechanically when exposed to an electric field. This behavior stems from its crystal structure, which lacks a center of symmetry. When compressed or stretched, the charges within the quartz crystal lattice shift, creating a voltage across its surfaces (Figure 1). Conversely, applying an alternating electrical current causes the quartz to vibrate, a phenomenon fundamental to quartz crystal microbalances (QCMs).
Figure 1. Charge displacement in quartz due to asymmetrical crystal structure.
The resonant frequency is the specific frequency at which a quartz crystal vibrates most efficiently when energy is applied. At this frequency, the layers of atoms within the crystal lattice slide parallel to each other in opposite directions, creating a smooth and consistent shear motion. Therefore, the crystal oscillates with maximum efficiency, achieving the greatest amplitude while minimizing energy loss.
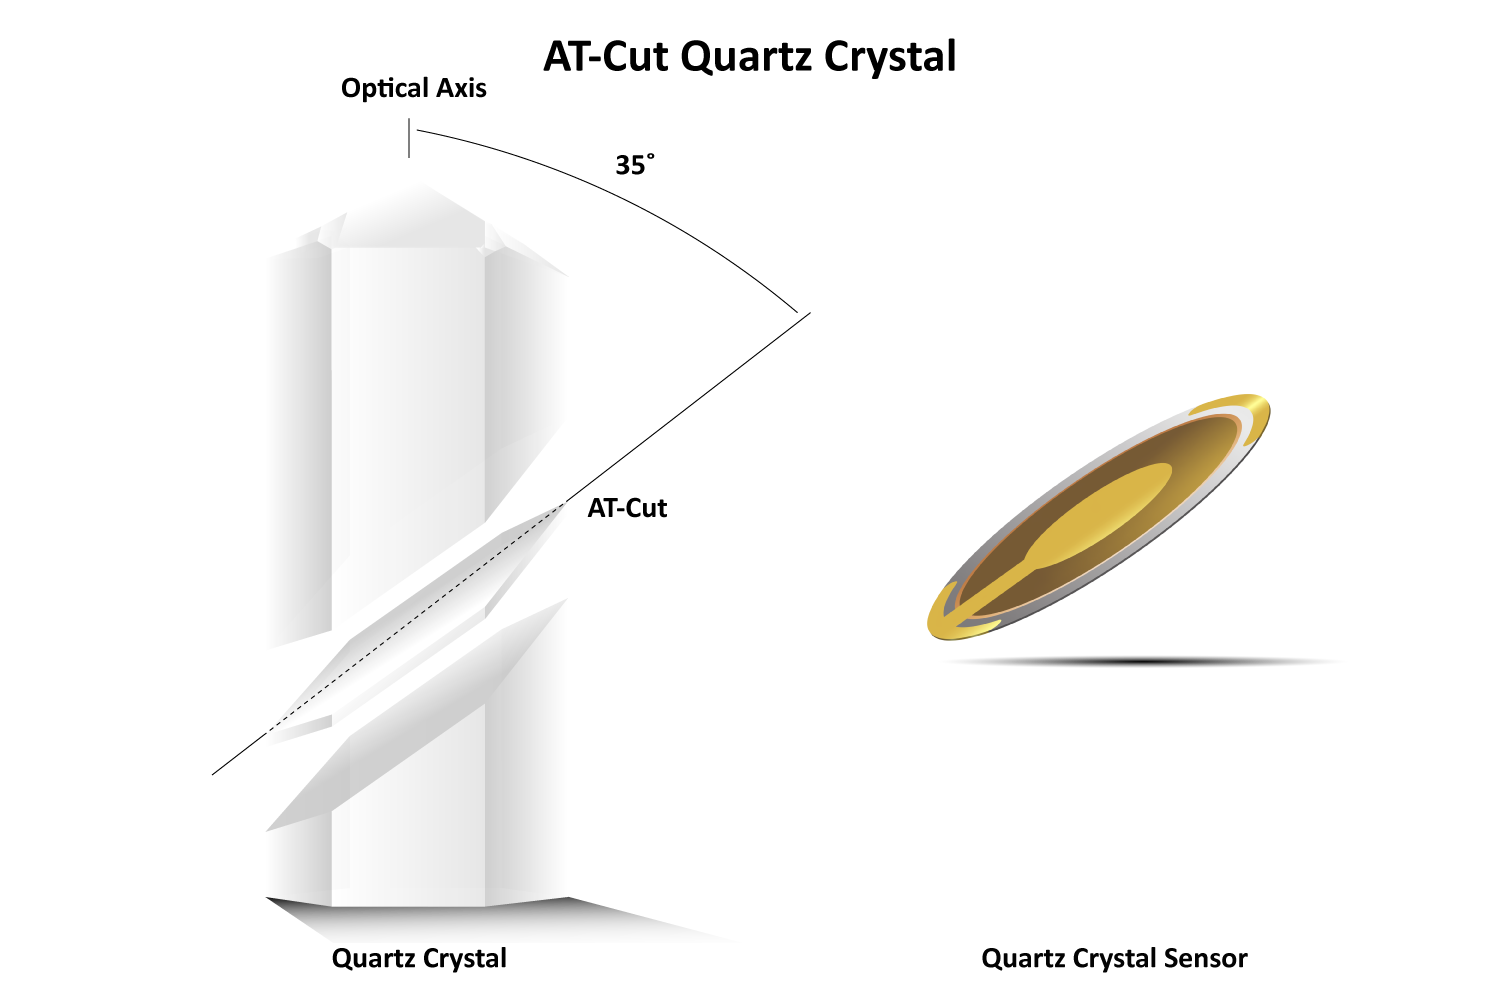
Beyond its piezoelectric capabilities, quartz has additional properties that make it ideal for ultrasensitive measurement devices like QCMs. It is abundant in nature, easy to grow and process, and its α-quartz phase remains thermodynamically stable up to 573 °C. To fabricate quartz crystal resonators, wafters are cut from bulk quartz at specific orientations relative to its crystallographic axis.
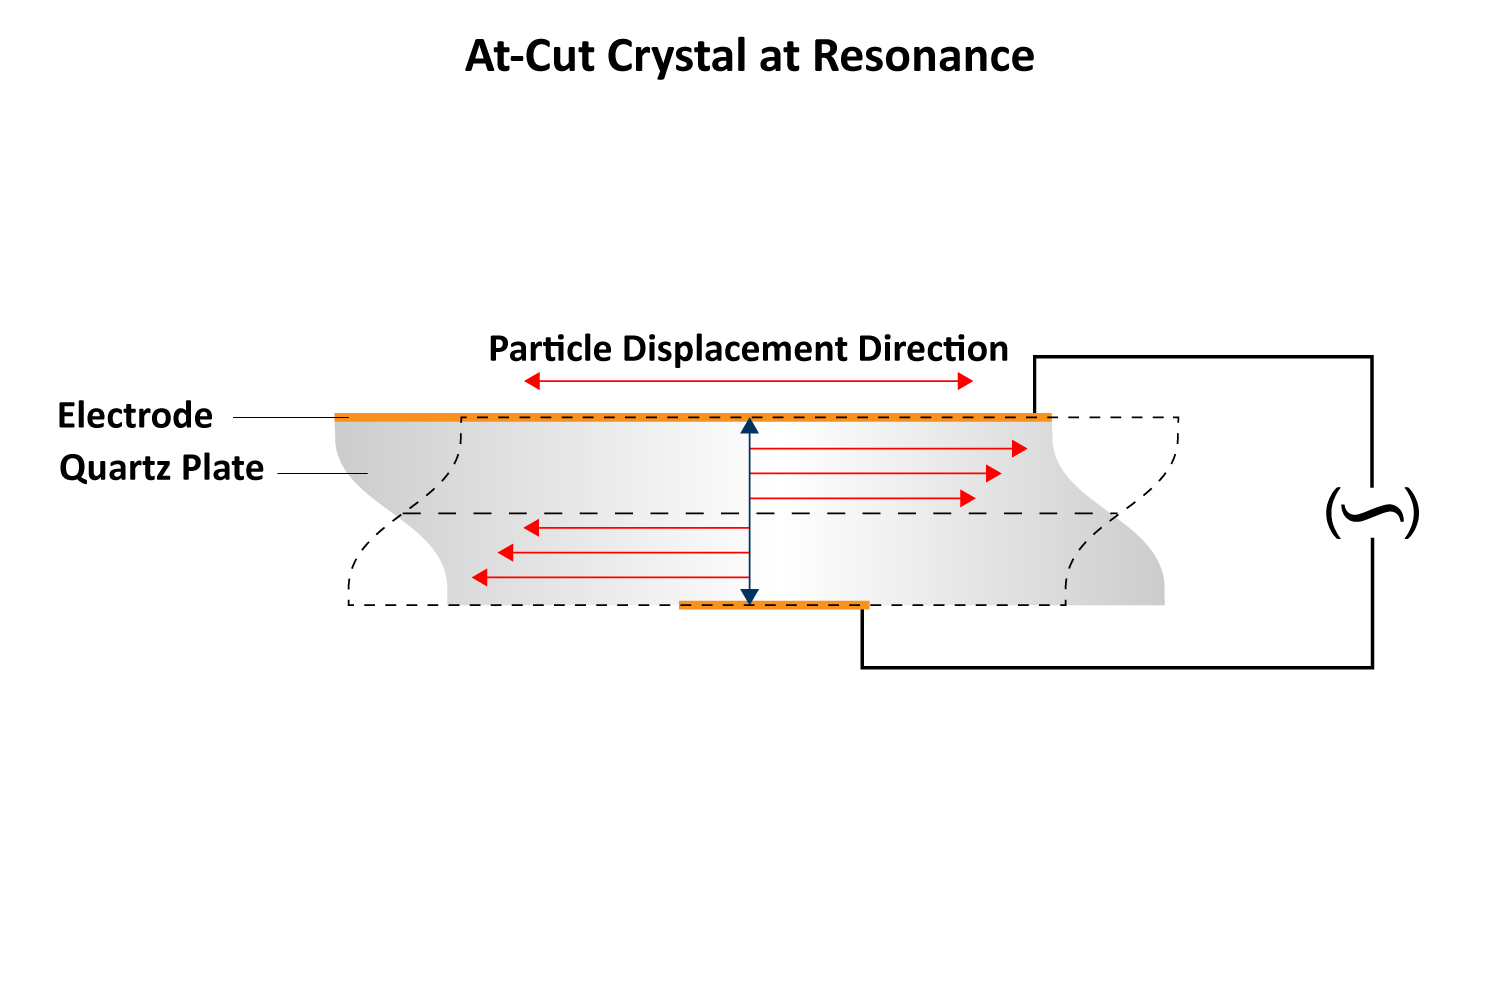
The most common cut for QCMs is the AT-cut (~35° to the z-axis), which produces a pure thickness shear mode oscillation, meaning the two surfaces of the crystal move in an anti-parallel fashion (Figures 2 & 3 ). AT-cut crystals are designed to be stable at room temperature (25 °C) with minimal frequency change (1-3 Hz/°C). However, when immersed in liquid, temperature effects become more pronounced due to the interaction between the shear oscillation and the liquid’s viscosity. For water, this can increase the temperature coefficient to approximately 8 Hz per °C. Strict temperature control (≤0.1 °C) or applying compensation is essential for accurate QCM measurements.
Figure 2. Quartz crystal cut at ~35° to the z-axis to produce an AT-cut disc.
Figure 3. Shear mode oscillation of an AT-cut quartz crystal at its resonant frequency.
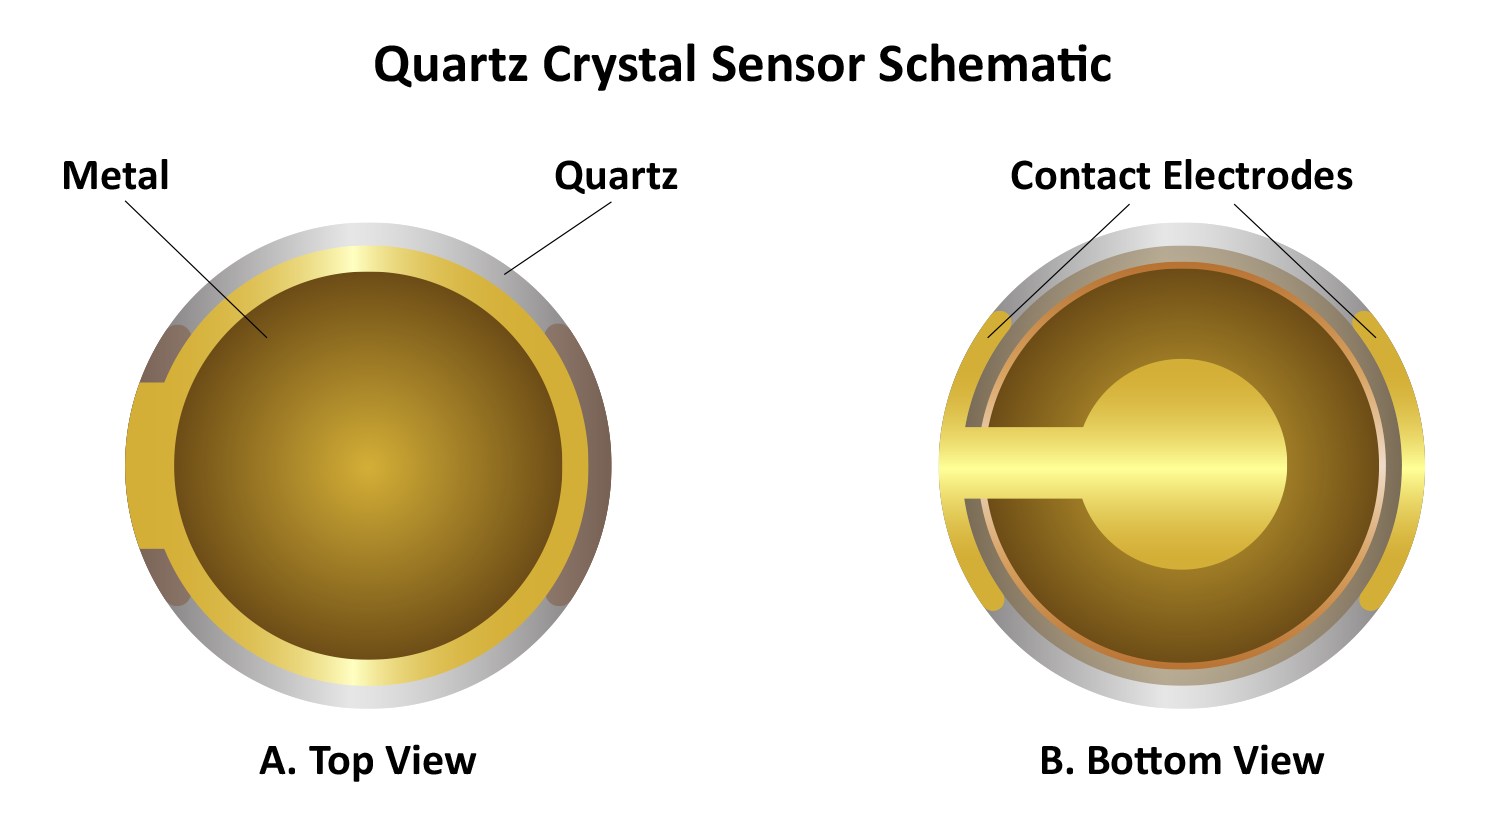
Two metal electrodes, typically gold, are sputtered onto the top and bottom surfaces of the quartz disc (Figure 4). When an alternating current is applied, the crystal oscillates at its resonant frequency, which is determined by its thickness. A standard 5 MHz quartz crystal has a thickness of approximately 330 μm. When mass is added to or removed from the crystal’s surface, the frequency changes, akin to how a guitar string’s pitch depends on its thickness. When a string is plucked, it vibrates at a specific frequency, producing an audible sound. In contrast, quartz crystal sensors resonate in the MHz range, imperceptible to the human ear.
Figure 4. Quartz crystal sensor with electrodes.
Harmonics
The fundamental frequency of an object is the lowest natural frequency at which it vibrates when it is set into motion. Overtones are the naturally occurring higher tones which are integer multiples of the fundamental frequency (2x, 3x, 4x, and so on). Musical instruments are audible examples of the fundamental frequency and overtones, notably obvious in crystal singing bowls and Tibetan throat singing. The AT-cut crystals used in QCM-D work the same way, though their frequencies are not audible. The geometry of their physical design only supports odd-numbered harmonics, typically up to the 7th.
Each increasing harmonic from the fundamental frequency penetrates at a decreasing depth, providing data from multiple perspectives to compare to the fundamental frequency. The sensor’s surface oscillation amplitude also decreases as the harmonic number increases.
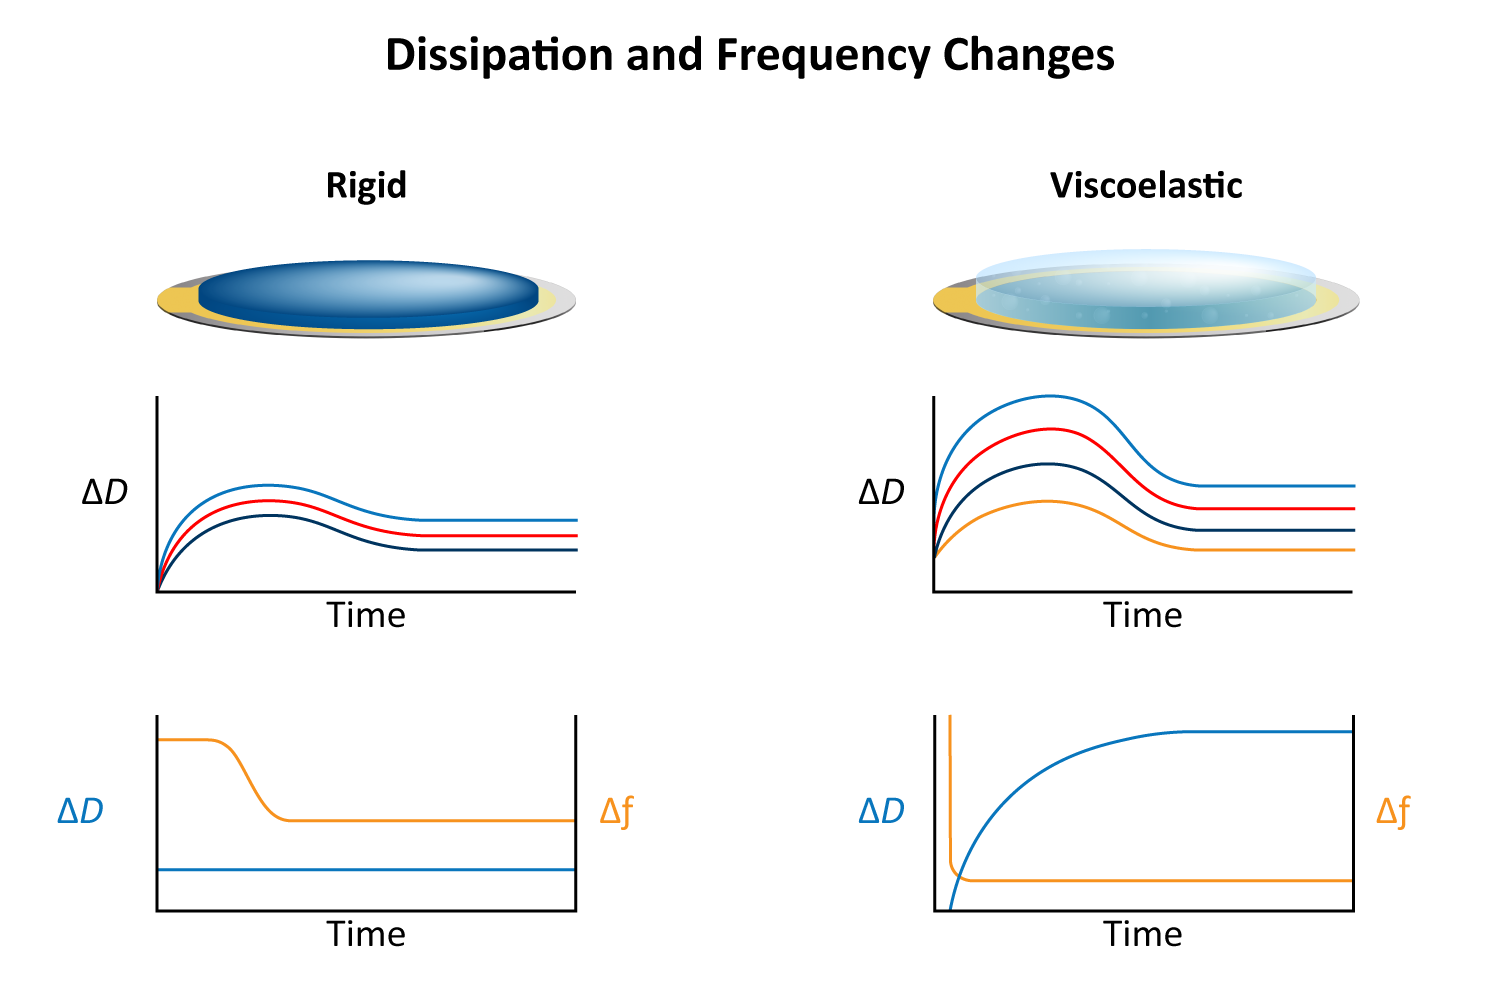
Rigid layers will show consistent ratios in frequency shifts (∆f) with harmonic order (e.g. ∆f₃ is ~3x ∆f₁), and viscoelastic or thicker films will show differing shifts for each harmonic (Figure 5 ). These multi-harmonic data unlock the characterization of the film’s mechanical properties.
Figure 5. Comparison of QCM-D response for rigid and viscoelastic films across multiple harmonics. Rigid films show low dissipation and a stable, proportional frequency shift over time. Viscoelastic films show increasing dissipation and nonlinear frequency behavior that varies with overtone.
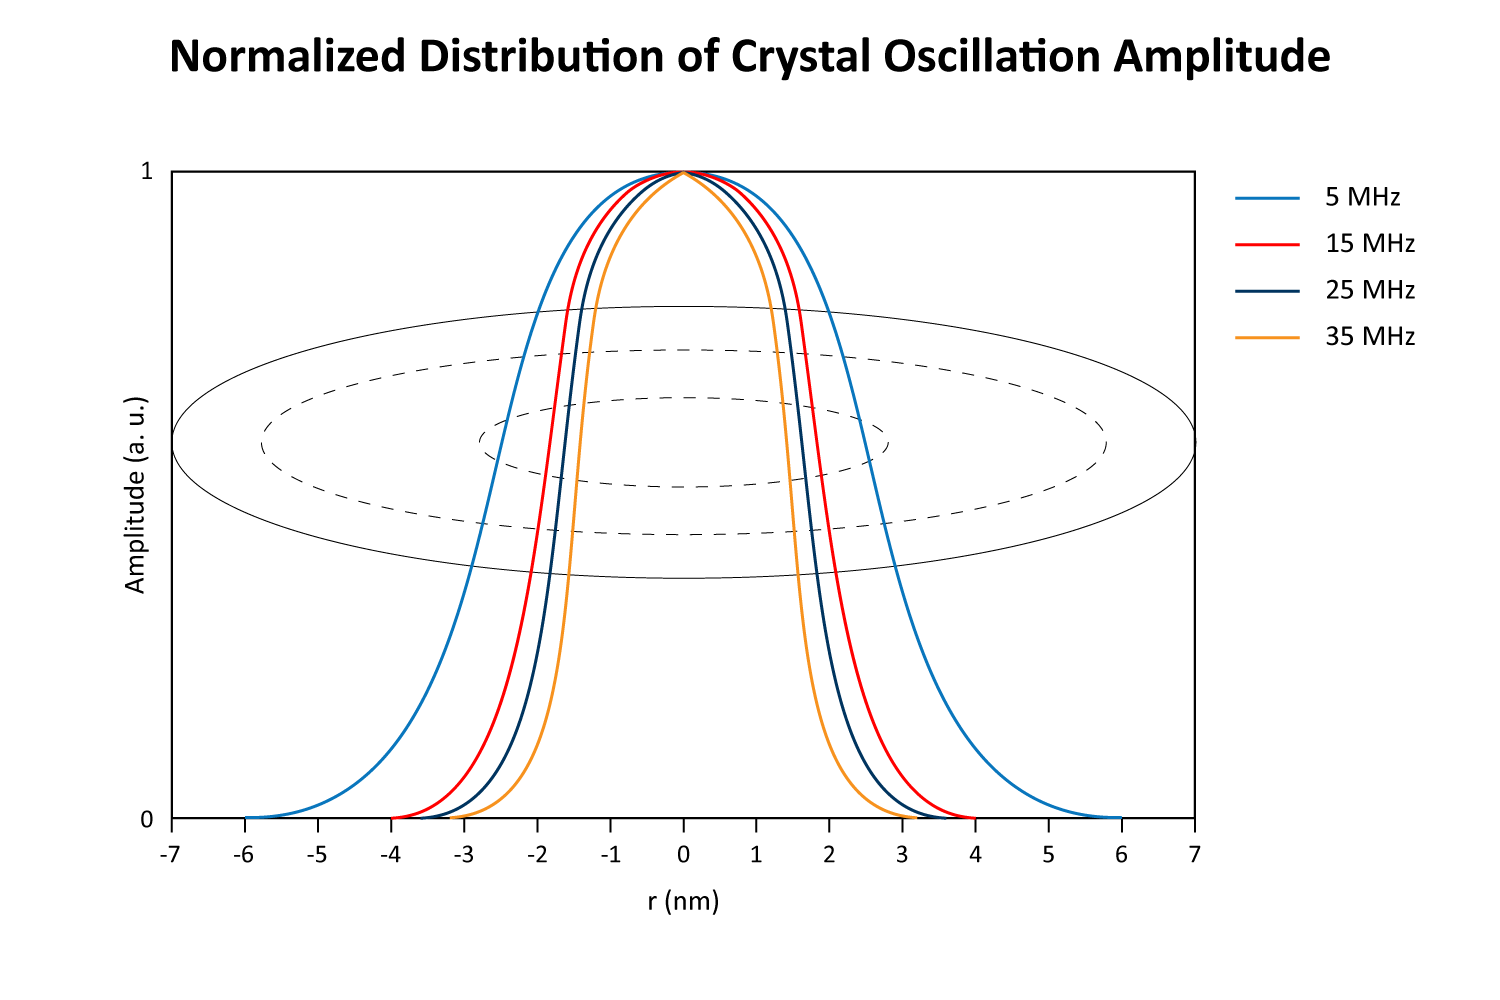
The crystal sensor’s oscillation amplitude is highest in the center and tapers off towards the edges, with higher harmonics exhibiting narrower bell curve distributions (Figure 6).
Figure 6. Normalized oscillation amplitude profiles for QCM harmonics. Higher harmonics (n=1, 3, 5, 7) exhibit narrower Gaussian distributions, concentrating sensitivity near the center of the sensor. The crystal disc is represented by the solid black line, with the electrodes represented by the dashed lines.
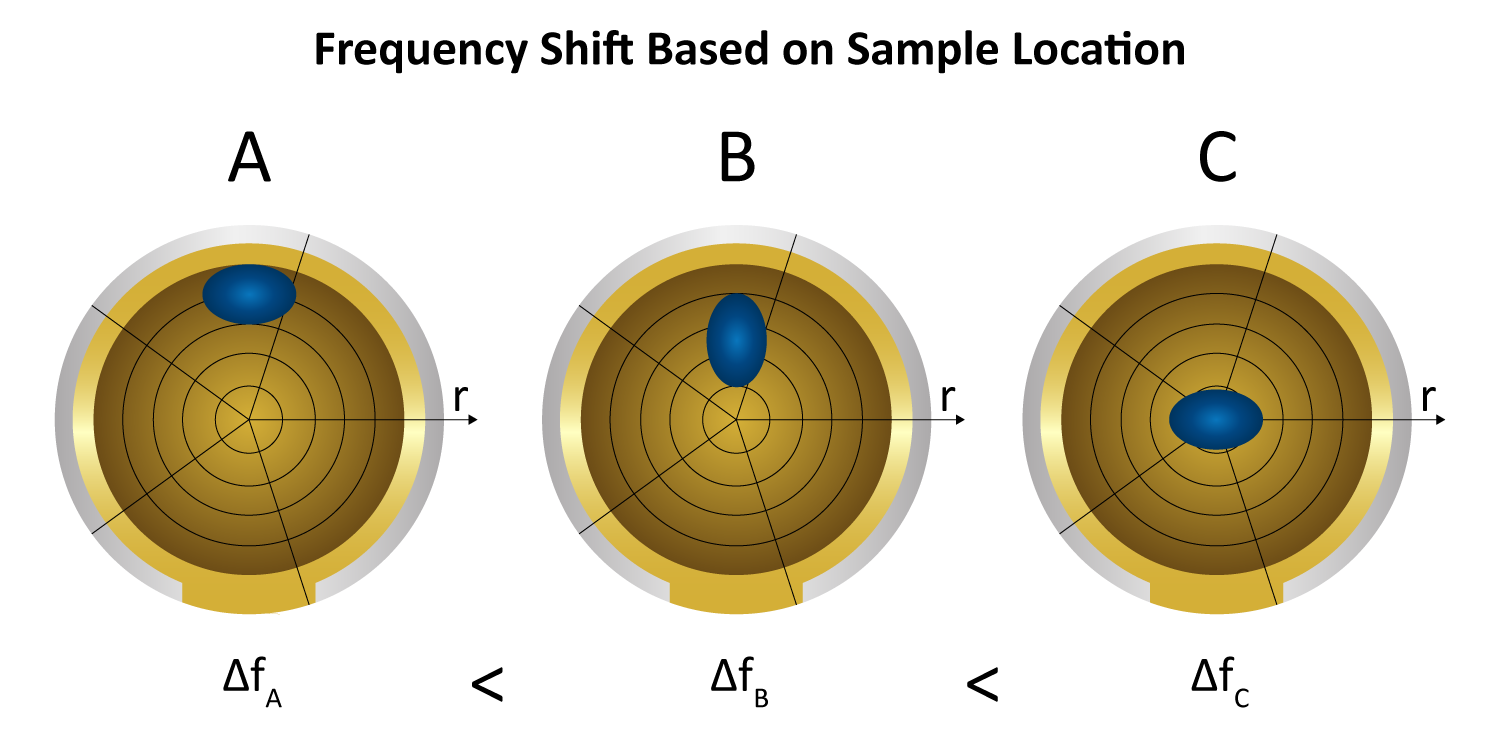
Because the instrument reports a total frequency shift (∆f) summed over the entire surface, localized mass near the center—where amplitude is greatest—exerts a larger force on the crystal and thus generates as a bigger shift than the same mass at the rim. Consequently, an uneven layer (e.g. more buildup at the edges vs. the middle) can skew the measured ∆f, since equal masses in different radial positions do not produce equal responses (Figure 7). Nonetheless, relative changes (like monitoring an X% increase or reduction in mass) remain meaningful, as all deposited mass experiences the same fraction of change regardless of position.
Figure 7. Identical masses at different radial positions produce different frequency shifts due to higher sensitivity at the center of the sensor.
Mass Sensitivity of QCM: Sauerbrey equation
The Sauerbrey equation is a fundamental principle in quartz crystal microbalance (QCM) technology that describes the direct relationship between changes in the resonant frequency of a quartz crystal and the mass added to its surface. Formulated by Günter Sauerbrey in 1959, the equation is expressed as:
Δm
=
-C x
Δf
n
∆m Mass Change, C Constant (related to properties of sensor), ∆f Frequency Change, n Harmonic (1, 3, 5 …)
where Δf is the frequency shift at harmonic n, Δm is the added mass per unit area, C is a constant related to the crystal’s properties and baseline frequency, and n is the overtone number (n = 1 corresponds to the fundamental).
Although n can be any odd harmonic (1, 3, 5, …), many QCM instruments measure more than just the fundamental frequency. Commonly, the 3rd, 5th, and 7th overtones are employed, each resonating at an integer multiple of the fundamental. Because these higher harmonics can probe slightly different depths of the sample, comparing frequency responses across multiple harmonics can help determine whether a layer behaves like a simple rigid mass or if more complex (viscoelastic or nonuniform) properties are present.
This equation assumes that the added mass is rigid, evenly distributed, and much smaller than the crystal’s mass. However, the equation is not valid for soft, viscous, or non-rigid layers, where viscoelastic effects must be considered. In practice, many samples deviate from Sauerbrey conditions once thickness or viscoelastic effects become non-negligible. Because standard QCM only measures frequency shifts (∆f), another measurement is needed for viscoelastic films: change in dissipation (∆D).
QCM-D: Integration of Dissipation Monitoring
Quartz Crystal Microbalance with Dissipation Monitoring (QCM-D) addresses the incapability of QCM to accurately measure soft, viscous, and non-rigid layers. Dissipation data reveal characteristics of non-rigid layers that undergo internal rearrangements and energy loss.
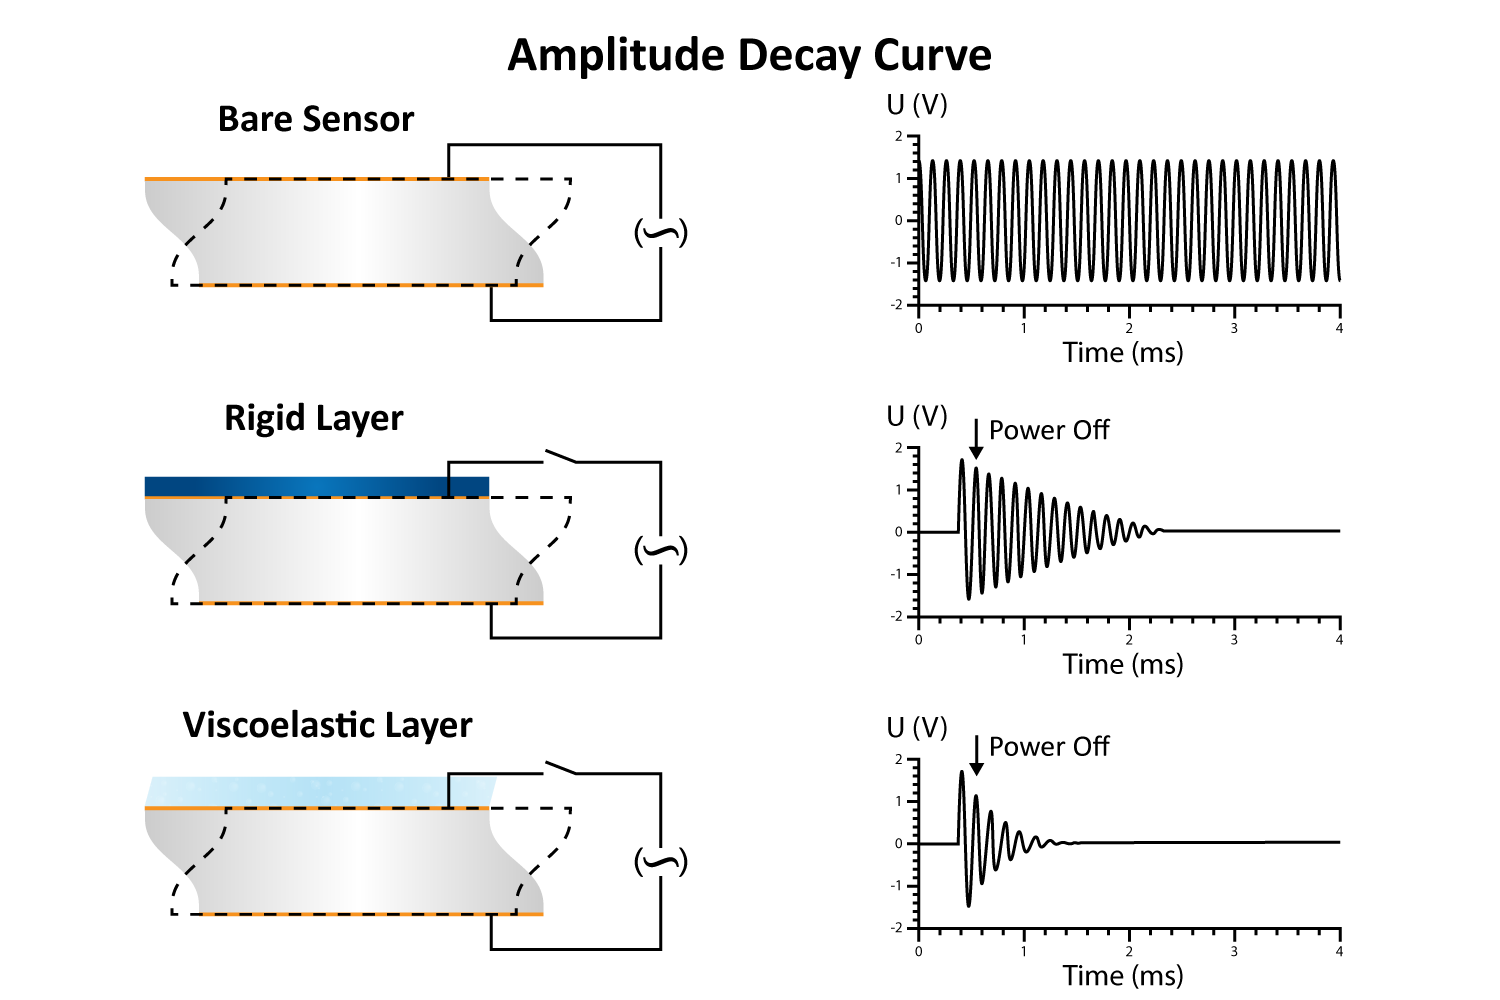
QCM-D utilizes quartz’s natural piezoelectric properties to detect decay. The quartz crystal is excited to its resonant frequency by applying a specific type of alternating electrical signal, known as a driving voltage. While alternating current (AC) voltage refers to any electrical signal that changes direction periodically, the driving voltage is carefully tuned to match the resonant frequency of the quartz for efficient excitation. Once the driving voltage is turned off, the amplitude of the oscillations decays over time, following an exponentially damped sine wave, given by:
A(t) = A0 et/τ sin(2πft + φ)
A Amplitude, t Time, e Exponential growth (τ>0 growth, τ<0 decay), τ Decay Time Constant, f Frequency, φ Phase Angle
where A is the amplitude, t is time, τ is the decay time constant, f is the resonant frequency, and φ is the phase angle. The term e^{t/ describes the exponential growth or decay of the signal, depending on the sign of τ (positive for growth, negative for decay).
The decay time constant (τ) is inversely proportional to the dissipation factor (D), which quantifies energy loss in the system:
D
=
1
2πfτ
D dissipation factor, f frequency, τ is the decay time constant.
By numerically fitting the decay curve to the damped harmonic oscillator equation, both frequency and dissipation can be obtained simultaneously for more effective data interpretation. The decay time constant indicates the rigidity or softness of the mass adsorbed on the crystal surface (Figure 8). For example, rigid materials (e.g. metal films, ceramics) strongly adhere to the quartz and oscillate in sync with it, leading to a slower decay of oscillations. Soft or viscoelastic materials, (e.g. proteins, lipids), dissipate energy, causing the oscillations to decay more quickly.
Figure 8. Exponential decay of oscillation amplitude after the driving voltage (⏦) is turned off. The overlaid sinusoidal waveform represents the continued oscillation of the sensor, which is damped over time. Rigid materials show slower decay due to stronger coupling with the quartz sensor. Softer, more viscoelastic layers cause faster decay and higher energy dissipation.
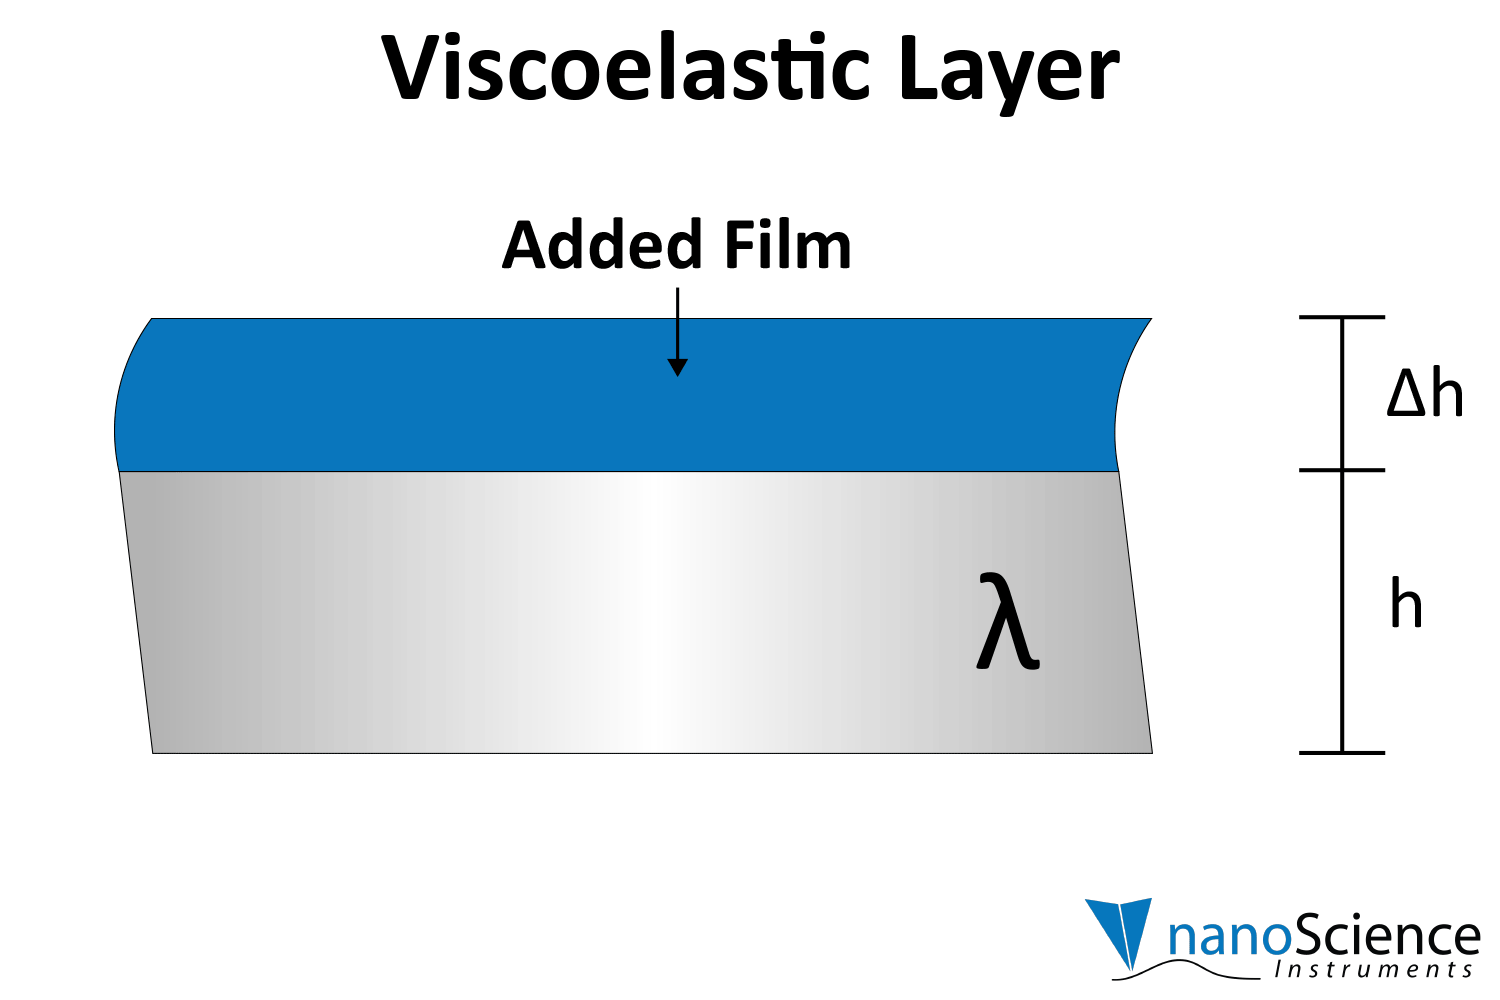
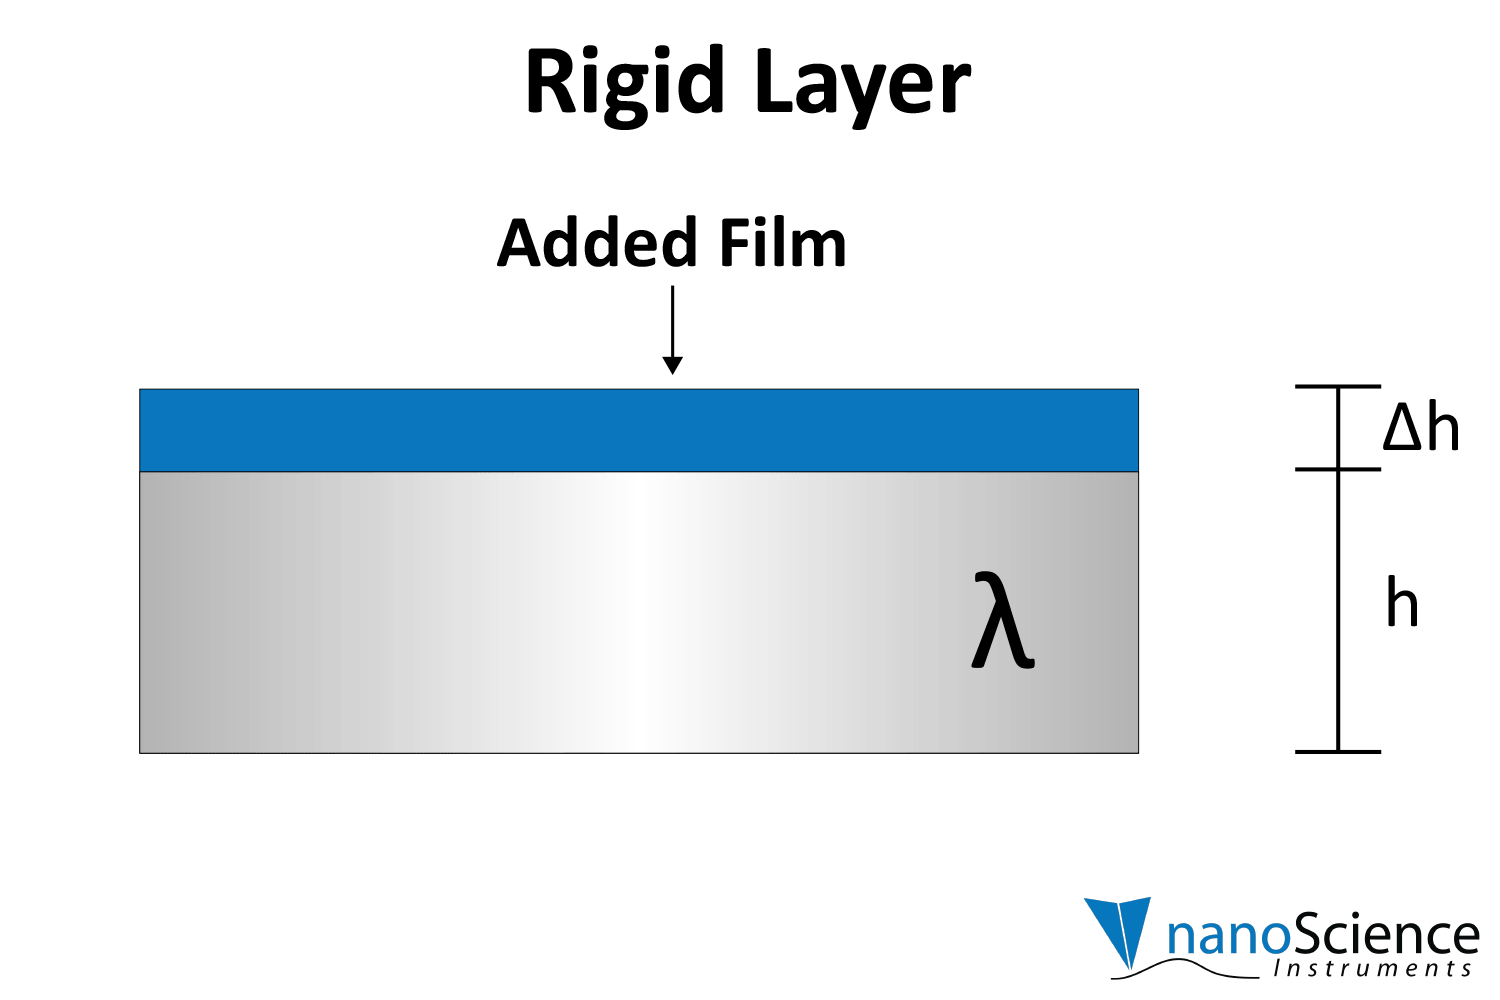
What are Viscoelastic Materials?
Viscoelastic materials, such as protein layers, hydrogels, and lipids, exhibit both viscous and elastic characteristics, enabling them to deform or flow when subjected to external forces. When vibrations from the quartz crystal pass through such materials, they induce internal deformations—bending, stretching, compressing, or internal flow. This movement results in molecular rearrangements, such as the sliding of polymer chains (as in gels) or the compression and expansion of internal structures like pores and fibers. These internal dynamics generate friction and resistance, dissipating energy primarily as heat. This causes vibrational energy to be absorbed by the material and converted into internal motion, effectively dampening the oscillations. This dampening effect alters the system’s oscillatory behavior, manifesting as shifts in resonant frequency and changes in energy dissipation. Thick or viscoelastic layers behave much like Jello on a plate; when a plate with a Jello slab on it is moved back and forth, the Jello wiggles out of sync from the plate (Figure 9a). In contrast, rigid layers move in sync with the sensor, more like a tightly bound block (Figure 9b).
a
b
Figure 9. A) Viscoelastic film: deforms independently, dissipates energy. B) Rigid film: moves in sync, conserves energy.
What does QCM-D measure?
QCM-D measurements capture both the amount of material at the sensor surface and how that material behaves mechanically. The resonant frequency shift (Δf) reports on mass changes (including bound solvent), while the dissipation shift (ΔD) reveals whether the layer is rigid, soft, or reorganizing. Tracking these two parameters in real-time yields a detailed view of how a film or layer evolves under different conditions.
Adsorption and Desorption: When molecules deposit onto the sensor, Δf shifts negatively as mass accumulates. If the adsorbed layer is soft or hydrated, ΔD also increases, signifying a more dissipative film. Conversely, partial or complete removal of material drives Δf upward and often lowers ΔD as the film thins or becomes more rigid.
Crosslinking: A crosslinking reaction may not greatly change Δf if the same overall mass remains on the surface, but it can produce a clear drop in ΔD. This decrease in dissipation reflects the film’s transformation from a loose, mobile network into a more cohesive and elastic one.
Swelling and Collapse: Stimulus-responsive layers or polymer films frequently trap or expel solvent. During swelling, Δf shifts more negative (indicating an increase in total mass, including solvent), while ΔD often rises as the film becomes softer or more hydrated. A collapse or dehydration process shows the opposite trend, driving Δf upward and ΔD down as the film becomes denser.
Interaction Kinetics: Because QCM-D tracks changes over time, it can reveal how rapidly binding or unbinding occurs at a surface. Adsorption profiles, reaction rates, and time-dependent shifts in the film’s mechanical properties all emerge from monitoring Δf and ΔD. This time-resolved data helps distinguish, for instance, fast surface attachment from slow, conformational reorganizations or multiphase reactions.
In this way, QCM-D connects molecular-scale events to the measured frequency and dissipation signals, which quantify not only the amount of material but also how that material interacts, transforms, and adapts on the surface.
Components of a QCM-D Instrument
A QCM-D instrument consists of several key components that work together to measure frequency and dissipation changes. At its core is a quartz crystal sensor with electrodes on both its front and back surfaces. This crystal is housed within a flow module, where liquid or gas samples flow across the sensor’s surface. A pump circulates the sample solution, while a temperature-controlled chamber maintains stable operating conditions. Finally, an electronics unit applies voltage to drive the crystal’s oscillation and records the resulting frequency and dissipation changes.
The thin quartz crystal disc is sandwiched between two electrodes that apply an alternating voltage to drive it into its resonant frequency. The electrodes on the front and back of the quartz crystal are typically keyhole-shaped, and the crystal itself is often thicker at the center than at the edges. This design directs oscillation to the center, where the electrodes are located, preventing excessive energy loss at the edges. Consequently, the wave motion remains concentrated, allowing secure mounting without significant dampening. The crystal surface can be coated with a wide range of materials, such as metals, polymers, and nanomaterials, providing extensive customization across diverse research applications.
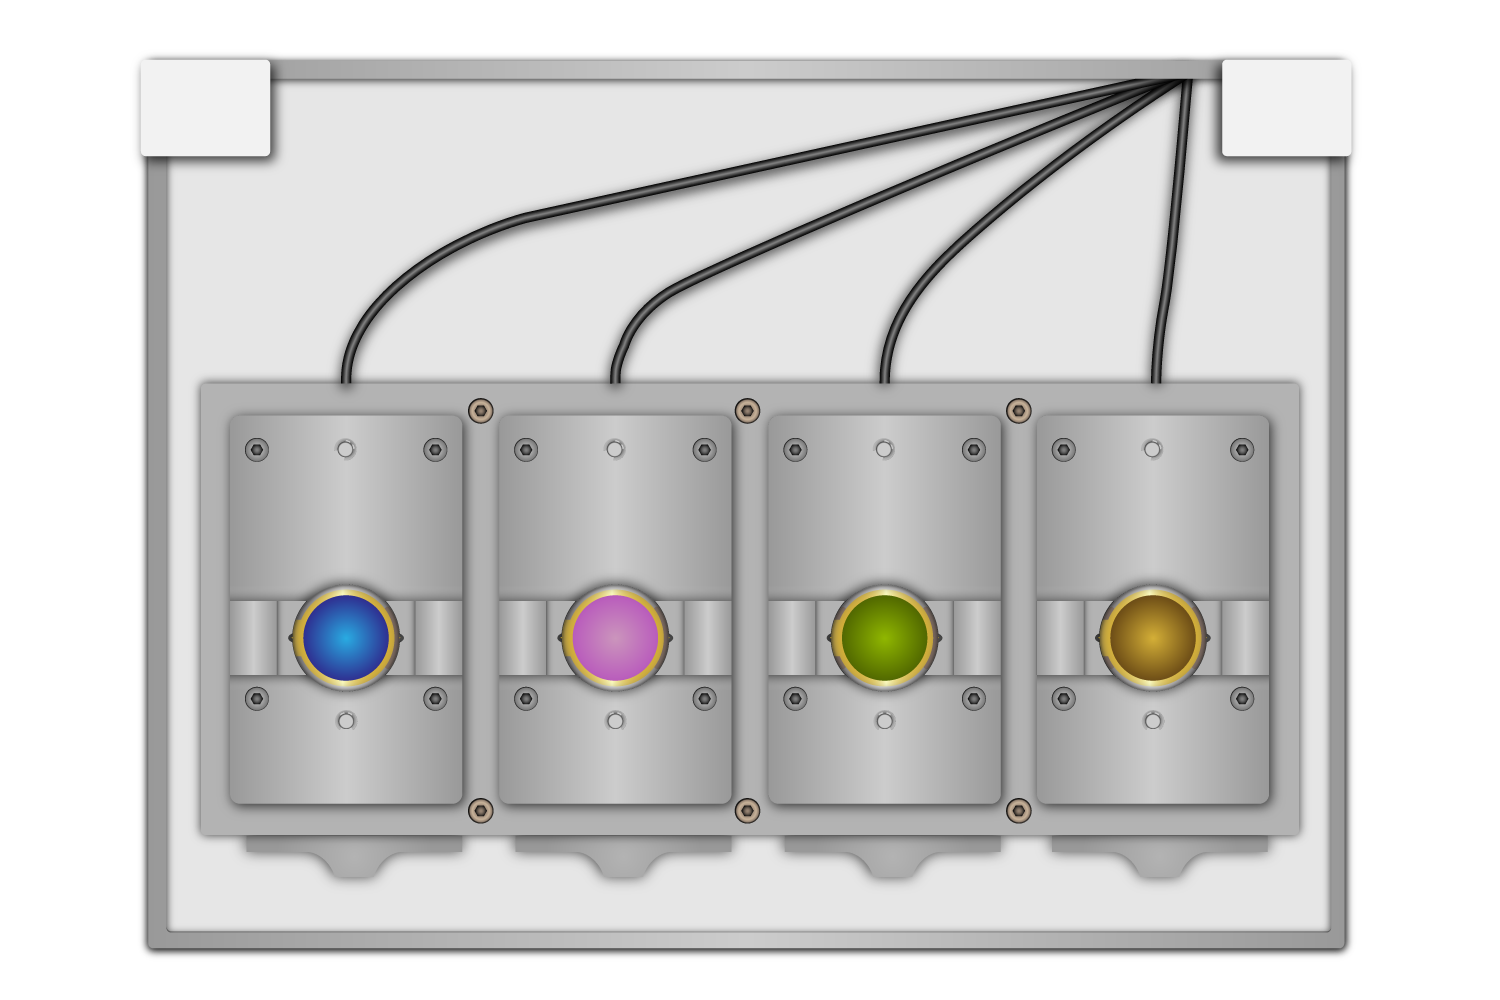
Flow modules house the quartz crystal sensor in a controlled environment and are detachable for simple cleaning and maintenance between experiments. Most QCM-D systems feature multiple flow modules, with some models accommodating up to four, measuring frequency and dissipation across multiple sensors simultaneously (Figure 10).
Figure 10. Four detachable flow modules, each holding an individual quartz crystal sensor, for simultaneous four-channel QCM-D measurements.
Flow modules are supported by the chamber platform, which provides structural stability and includes advanced thermal regulation. The platform’s thermoelectric heating and cooling system regulates precise temperature control, minimizing temperature fluctuations that could impact measurement accuracy.
Techniques Used with QCM-D
While QCM-D measures real-time mass changes and viscoelastic properties at surfaces, it does not paint a complete picture of molecular interactions, chemical composition, or structural changes. Additional measurement techniques elucidate hydration effects, chemical identity, spatial distribution, and electrochemical activity, filling in the gaps where QCM-D has limitations. These methods strengthen interpretations and improve accuracy, particularly when studying soft materials, surface chemistry modifications, or electrochemical processes.
Electrochemical QCM-D (EQCM-D)
Electrochemical quartz crystal microbalance with dissipation monitoring (EQCM-D) records real-time mass and structural changes at the electrode surface. This technique captures processes such as electropolymerization, ion intercalation, corrosion, and electrodeposition. Simultaneous QCM-D and electrochemical measurements track mass deposition and removal alongside electrochemical reactions.
The setup functions in a range of environments, including organic solvents and harsh chemical conditions. Specialized connectors integrate the system into glove boxes for controlled atmosphere studies. Sensor surfaces such as gold, platinum, and carbon-based coatings mimic electrodes, with custom modifications available for specific experimental needs.
Measurements at multiple harmonics improve the characterization of rough or porous electrodes, such as those used in Li-ion battery research. By capturing mass, viscoelastic, and electrochemical data simultaneously, EQCM-D deepens the study of charge transfer mechanisms, electrode degradation, and thin-film deposition.
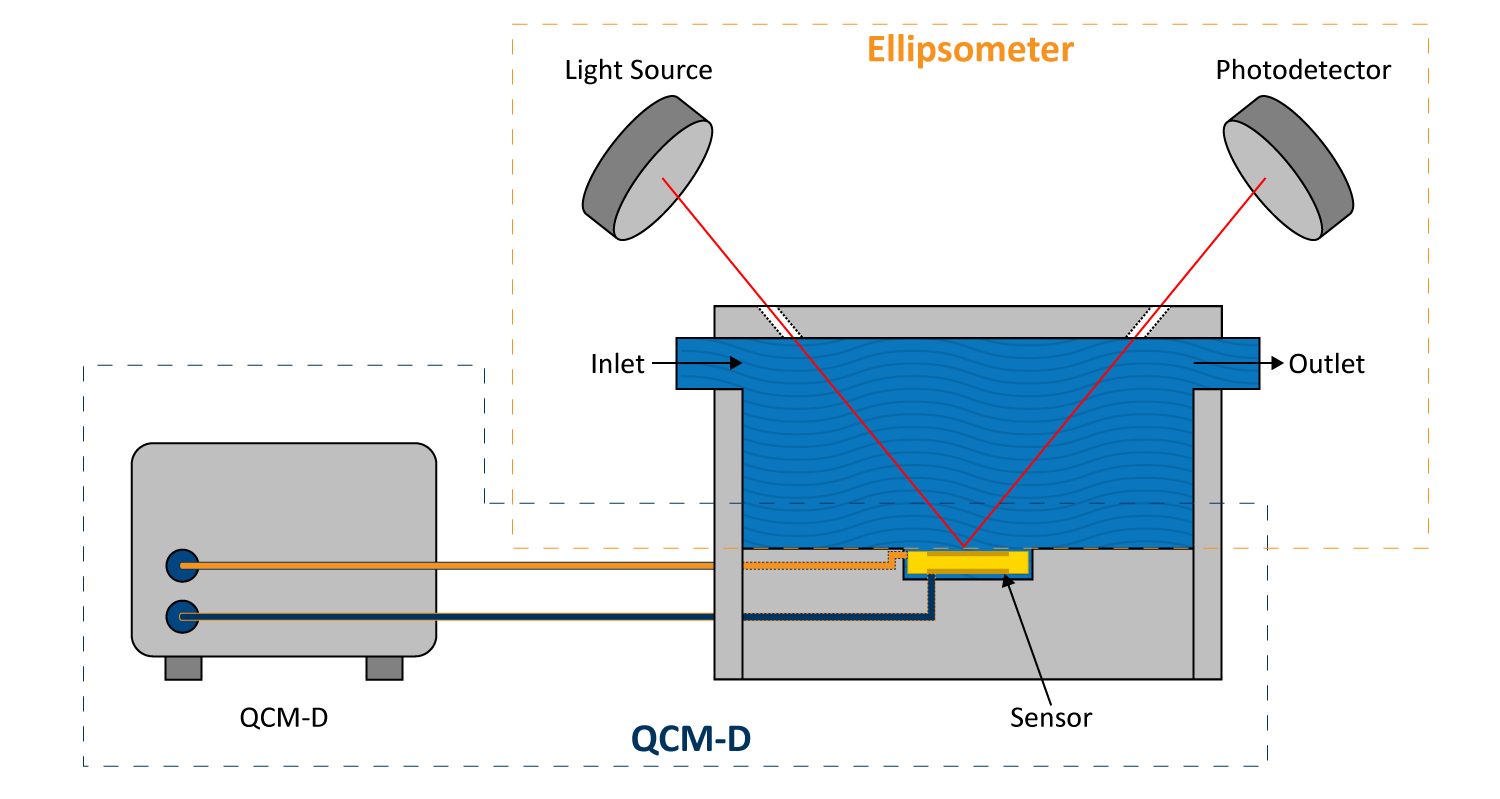
Ellipsometry
Ellipsometry is an optical technique that measures changes in the polarization of reflected light to analyze thin films. Used alongside QCM-D, it helps determine film thickness, refractive index, and optical properties, offering a complementary perspective on surface interactions. This combination is particularly useful when studying soft films where hydration affects molecular structure, as QCM-D accounts for coupled water while ellipsometry reflects the dry layer more accurately.
When used together (Figure 11), these methods enhance the analysis of biomolecular adsorption, polymer coatings, and electrochemical interfaces. Ellipsometry also detects variations in layer uniformity and molecular orientation, making it a valuable tool for biosensor development and material studies. Mass, thickness, and structural properties in complex surface systems can be more accurately quantified by comparing data from both techniques.
Figure 11. Schematic of a combined QCM-D/ellipsometry setup. A gold-coated quartz crystal sensor (yellow) sits in a flow cell (grey) through which liquid (blue) is pumped; QCM-D electronics (orange leads) monitor shifts in resonance frequency and dissipation, while an ellipsometer (dashed box) directs polarized light beams (red arrows) through the sample to measure film thickness and refractive index.
Optical & Fluorescence Microscopy
Optical and fluorescence microscopy confirm surface changes observed with QCM-D by visualizing adsorption, desorption, and structural rearrangements directly on the sensor surface. These methods distinguish between uniform and patchy adsorption, identify defects in molecular films, and reveal aggregation or clustering that would otherwise go undetected. In biosensing and material science, microscopy detects inhomogeneities that could explain unexpected shifts in frequency or dissipation.
Fluorescence microscopy provides additional contrast by labeling specific molecules with fluorescent markers, making dynamic interactions more apparent. Protein adsorption, lipid bilayer formation, and polymer deposition can be visualized in real-time, correlating molecular distribution with QCM-D signals. Fluorescently tagged biomolecules highlight binding events, conformational shifts, and layer thickness variations, clarifying whether QCM-D responses stem from uniform layer formation or localized accumulation. In combination with QCM-D, these imaging techniques establish a clearer connection between surface mass changes and the structural organization of the material.