Introduction
Scanning electron microscopes (SEMs) are staple tools for analyzing the structures and elemental makeup of surfaces with high resolution. Bringing SEM instruments in-house can provide immense value to organizations that require microstructural analysis and prioritize fast turnaround times. Integrating these complex instruments into existing workflows or research processes can be a significant undertaking, and several challenges may arise during the process.
Operating and maintaining SEMs requires specialized knowledge and skills. It may be necessary to hire or train staff members so that they can serve as expert users. However, even skilled users can find collecting large amounts of data tedious, which can deteriorate the quality of data due to user fatigue. Even with standard operating procedures in place, maintaining consistency in the conditions under which SEM images are collected and eliminating all user bias regarding data collection and analysis is not practical.
Automation
Automation offers a comprehensive solution to the many challenges faced by organizations wanting to get the most out of their SEM instruments. Automated processes run smoothly without user intervention, enhancing the speed, accuracy, and reproducibility of SEM workflows thereby making them more efficient and accessible. Automation can be applied to data collection, data analysis, or both. By streamlining and standardizing imaging conditions, implementing batch imaging, and making use of Boolean operations, statistically relevant datasets can be acquired and analyzed leading to actionable decision-making.
An intuitive graphical user interface (GUI) is an important facet of an effective automation platform for SEM. The GUI should allow users to easily customize and initiate a semi-automated or fully automated workflow. Customized report templates can also be built and accessed within the GUI, allowing data-driven decision-making to take place regardless of a user’s level of experience with SEM.
Some applications of SEM automation include the following:
- Standardizing imaging parameters: automation software controls and optimizes beam current, accelerating voltage, working distance, focus, brightness, and contrast.
- Data collection: streamline batch imaging by defining the number of imaging locations, either at randomized or defined locations, and the magnification(s) at which images are collected. This allows for streamlined large-area imaging or targeting specific areas of interest within a sample.
- Data analysis: automation allows custom workflows for the measurement of various dimensions from similar samples. Some examples of this include measuring critical dimensions in semiconductor devices, measuring coating thickness from a cross-sectioned sample, or measuring particle, pore, or fiber diameters. Automation can also enable the efficient collection of compositional data from energy-dispersive X-ray spectroscopy (EDS) on features of interest.
- Advanced imaging techniques: some examples include image stitching to create large field-of-view images, 3D reconstruction for mapping surface topography, and composite images that increase depth of focus.
How are SEMs automated?
SEMs automation can be achieved through a combination of software and hardware integrations that allow monitoring and control of various instrument settings. A motorized sample stage allows the software to precisely control the sample position under the electron beam. Automation software provides control over important parameters such as the beam current, scanning area, working distance, contrast, brightness, and focus. Another essential feature of automation software is the ability to execute various commands so that automated tasks can be pieced together to create a unique workflow. The ability to develop a GUI is another essential feature of effective automation software for SEM, which makes it accessible to individuals without experience in programming.
The user interface of all Phenom Desktop SEMs is programmed in Python, a well-known and commonly used scripting language for instrumentation, data analysis, and data visualization. Python is an object-oriented programming (OOP) language, making it amenable to working with datasets, functions, and data processing. It is also much easier to learn and work with than other OOP languages. Hence, Python is an ideal candidate for developing custom routines to automate Phenom SEMs to handle routine and monotonous tasks.
Phenom Desktop SEMs are compatible with Python scripting by way of the Phenom Programming Interface (PPI). PyPhenom, a library of functions, is a good starting point while developing a custom script.
Why are SEMs automated?
Automating SEMs offers several benefits for users by taking over tedious and repetitive tasks. Some of these benefits include:
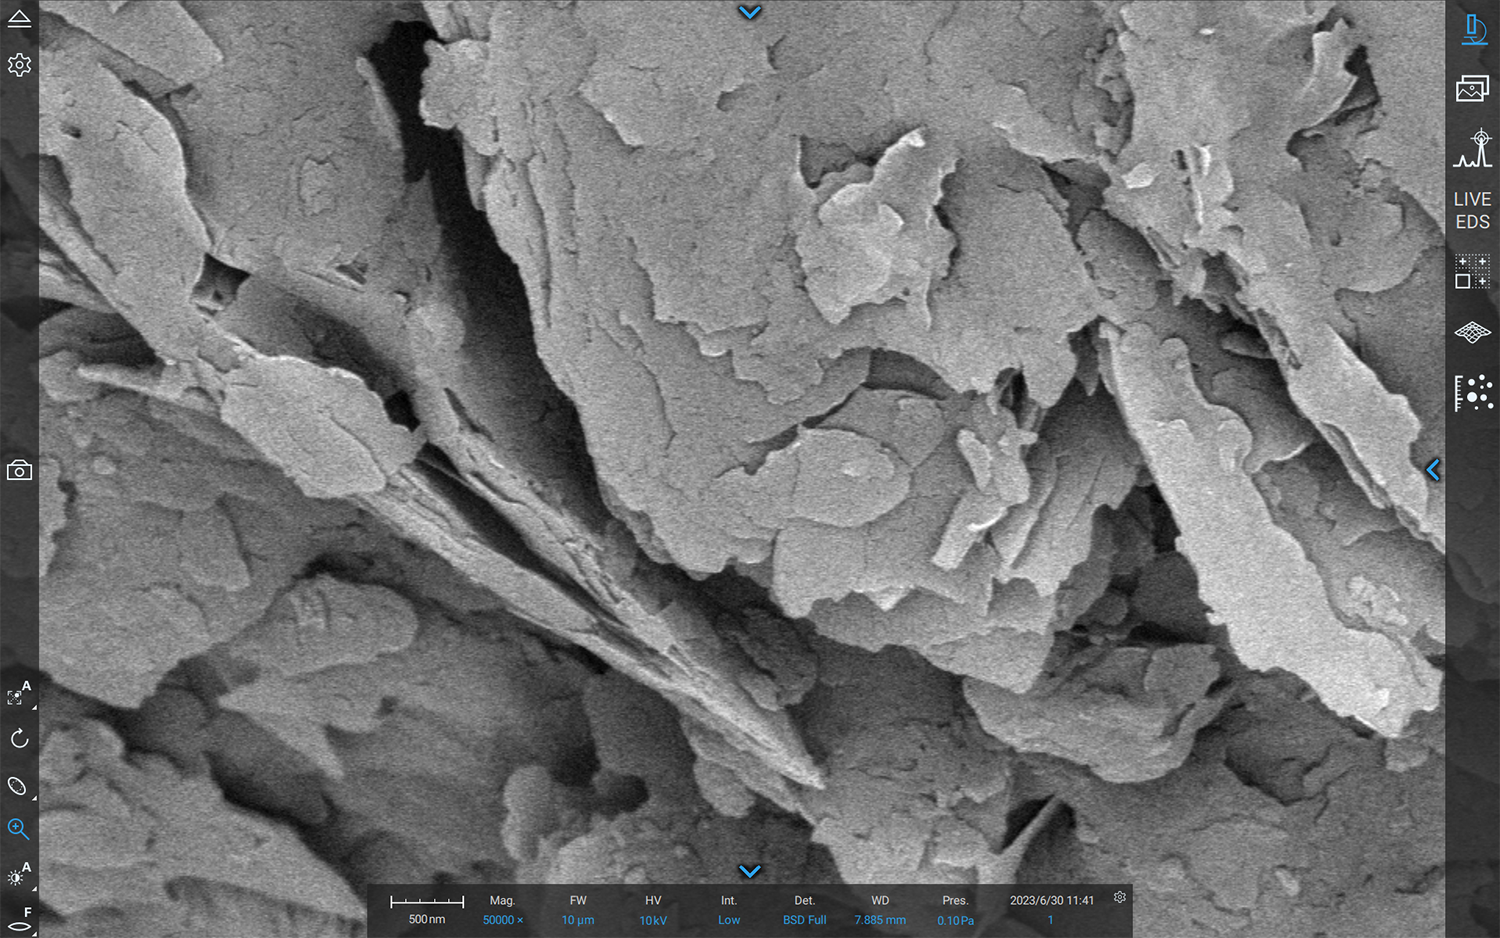
Increased Ease of Use: SEM automation can greatly enhance ease of use, making the technology accessible to a wider range of professionals and driving progress in the field of microscopy and beyond. By simplifying workflows and minimizing the need for specialized training, automation can democratize SEM analysis, allowing users to leverage the power of this technology. In addition, automation can help standardize protocols and data formats, making it easier for users to collaborate and share data across institutions and disciplines. Phenom SEMs have an intuitive and easy-to-use interface that can guide users through the process of setting up and analyzing samples allowing users with minimal training to operate the SEM (Figure 1). The addition of the PPI software to automate and standardize data collection makes for an even more improved user experience.
Increasing Throughput: One of the primary benefits of SEM automation is increased throughput. With traditional SEM analysis, researchers must manually adjust the instrument’s various settings, scan samples, and collect a myriad of relevant data, a process that can be time-consuming and prone to many errors.
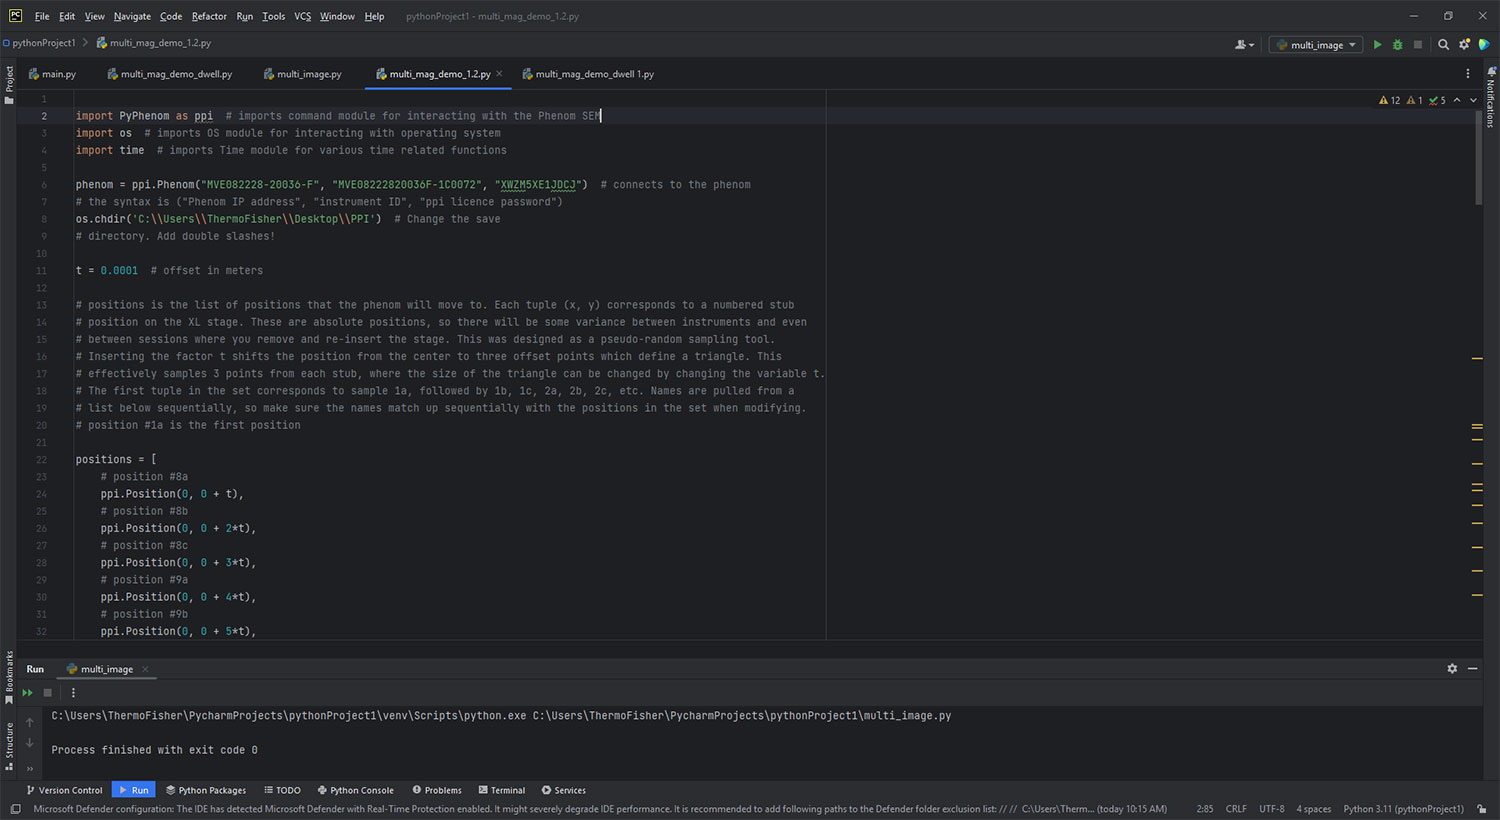
However, with automation, these steps can be standardized and streamlined to allow researchers to process vast amounts of data quickly and easily. Sample stages that can hold dozens of samples at once, allowing for continuous, uninterrupted analysis without the need for manual intervention can increase the throughput. The Phenom XL Desktop SEM is equipped with a large 100 mm x 100 mm sample stage that can hold up to 32 standard stubs. Using the Python-based PPI software (Figure 2), users can program the SEM to image the samples on the sample stage either in a defined pattern or at random locations. The location, the magnification of the image, and the number of images on each sample can all be programmed. This automation routine will result in a large amount of data being collected without user involvement.
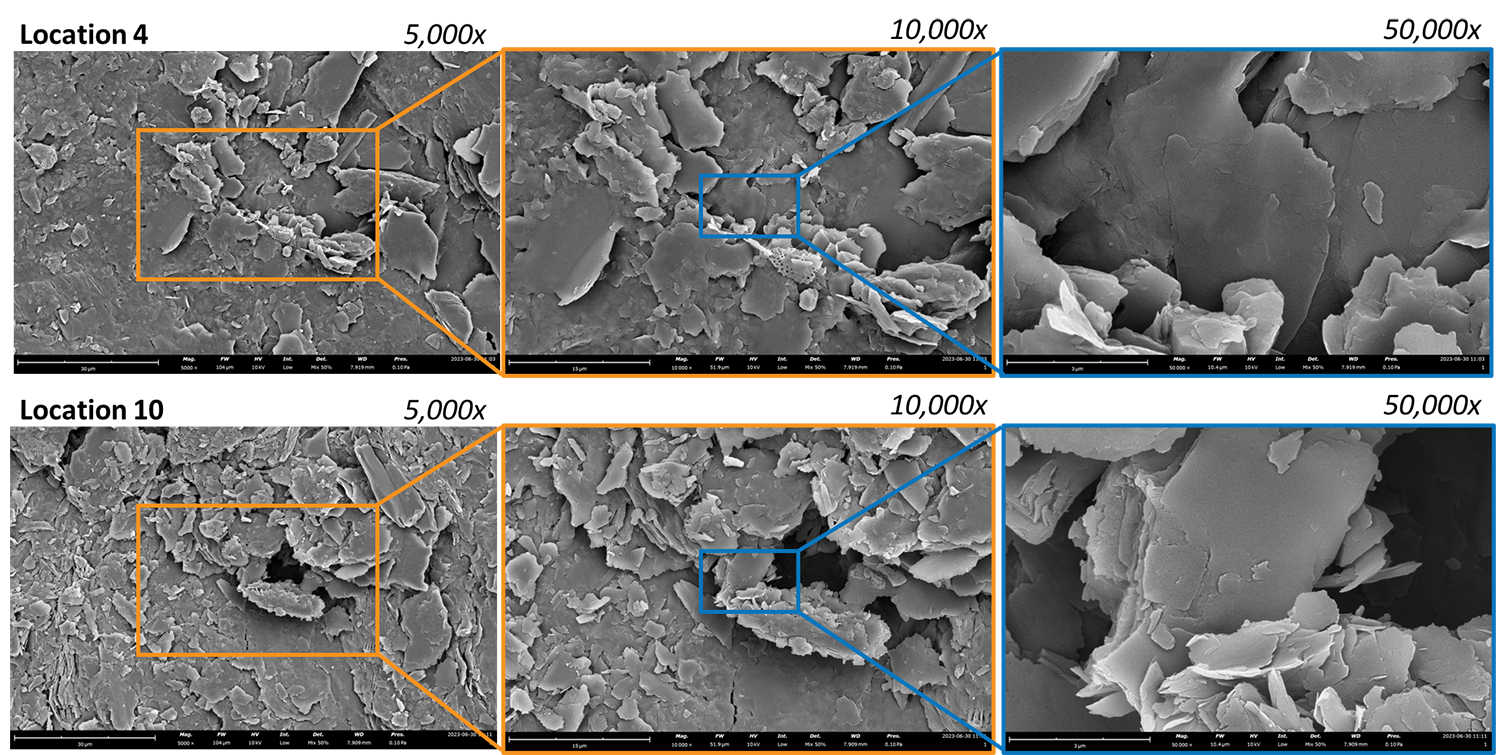
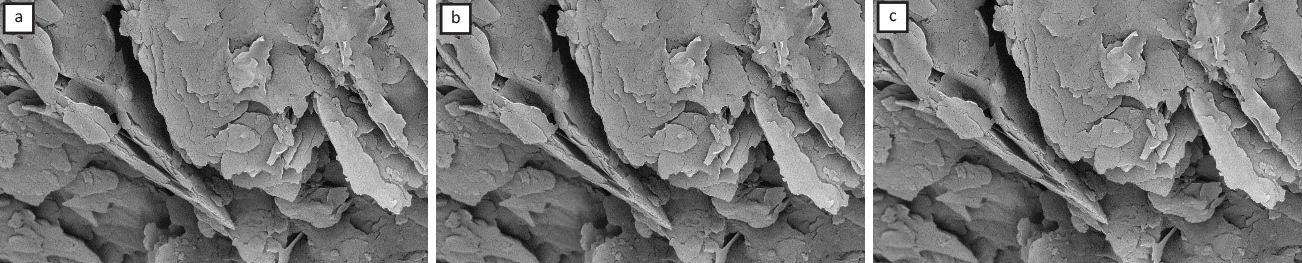
Reducing user fatigue: Repetitive actions can cause fatigue for microscopists who need to manually adjust parameters and acquire numerous images over time. Extend the time spent carefully optimizing one image to the time needed to obtain 10,000 images, and there will be significant drops in quality and inconsistencies across manual measurements. Automated SEMs take the possibility of fatigue away from users by performing functions independent of the user. By acquiring large amounts of precise and critical information, automated SEMs overcome the user bias and fatigue limitations of routine, manual analysis. Figure 3 shows the results of a script written in PPI designed to take SEM images at multiple locations and magnifications. The script not only automates the data collection but is able to collect high-quality images that are in focus. Automation of the data collection allowed 12 individual locations to be imaged at 5 magnifications (total 60 images) within 18 minutes, or about 18 seconds per image. Figure 4 shows SEM images of a sample of amphibole mineral acquired with a PPI script to collect SEM images over the same area at the same magnification.
Improving reproducibility by eliminating user bias: Another key benefit of SEM automation is reproducibility. With traditional SEM analysis, even small variations in instrument settings, or operator techniques can result in inconsistent results. However, automation can help to eliminate many of these sources of variability, resulting in more reproducible and trustworthy data.
Conclusion
The user experience of scientific instrumentation plays a significant role in how much they end up using the tool. Reducing the complexities within the process to a mere few clicks enhances ease of use and simplifies arduous workflows, improving the user experience. Automation takes a large portion of the identification and classification processes and turns them into a few steps. Users need not be monitoring the instrument while it collects large quantities of data. If the samples are prepared with care using standardized methods, automated SEMs can deliver consistent and statistically relevant results in relatively short periods while also taking out the redundancy of routine, manual analysis.