A scanning electron microscope (SEM) is capable of visualizing compositional heterogeneity on the surface of a sample by employing a backscattered electron detector (BSD). A BSD works by detecting elastically scattered electrons that are reflected from the sample surface as the electron beam is scanned across its surface. The higher the atomic number of the material, the more backscattered electrons will be generated, resulting in higher contrast in the BSD image. This mode of imaging in SEM provides valuable insights regarding the microstructure of the material under study.
While BSD imaging offers powerful insights into material composition and surface topography, analyzing materials containing elements that are close in atomic number can be challenging. A non-linear intensity mapping function, known as a gamma correction, is often the optimal solution for improving the ability to distinguish closely spaced elements in BSD images. Beyond this application, gamma correction can be used as a general tool to generate contrast over a targeted narrow range of gray levels, which can help in a wide range of imaging applications. This blog post explores the basics of gamma correction and provides some common application examples in SEM imaging.

What is Gamma Correction?
To understand how gamma corrections work, one must first understand how brightness and contrast adjustments linearly affect the grayscale histogram of an image. The grayscale histogram represents the distribution of intensity values within the image wherein the horizontal axis represents pixel intensity, and the vertical axis represents the total number of pixels at each intensity value.
Brightness adjustments translate the grayscale values (Figure 1a-b) along the horizontal axis to a higher or lower range without changing the overall shape of the distribution. Contrast adjustments either dilate or contract the intensity distribution by uniformly expanding or narrowing the range of grayscale values, respectively (Figure 1c-d).
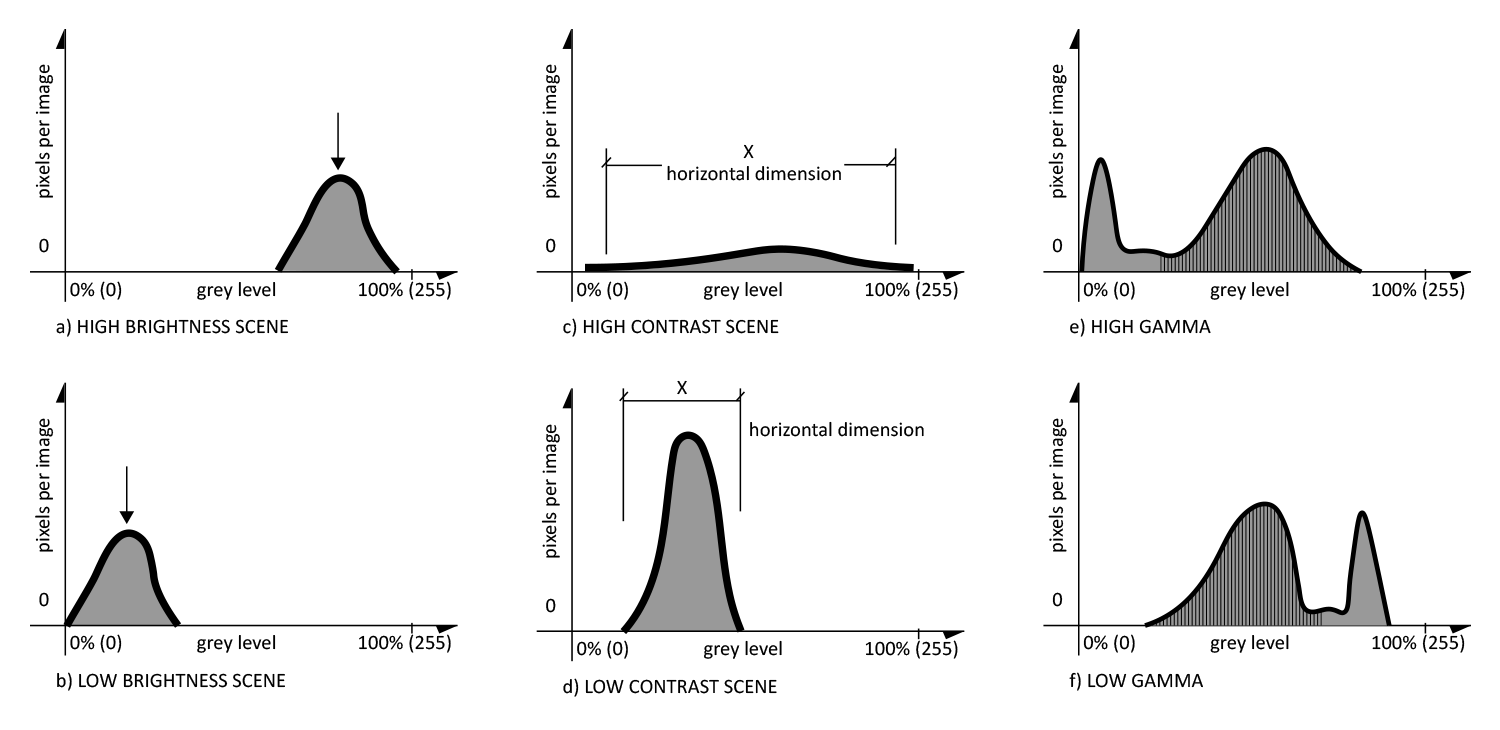
Unlike brightness and contrast adjustments, gamma corrections modify the intensity distribution selectively in a non-linear fashion. One portion of a grayscale histogram is compressed while the other is expanded (Figure 1e-f). This can be used to emphasize contrast differences within a small range of grayscale pixel values. An increased gamma value compresses the grayscale histogram towards darker tones, emphasizing the differences within darker areas. A decreased gamma value has the opposite effect, enhancing lighter features by compressing the histogram towards lighter tones.
Application Examples of Gamma Correction in SEM Analysis
Elemental differentiation:
The grayscale value of a pixel within an SEM-BSD image is dependent on the atomic number of the atom. Higher atomic number elements will interact with more electrons and appear brighter compared to lower atomic number elements. However, when atomic numbers are close together, they can be difficult to differentiate.
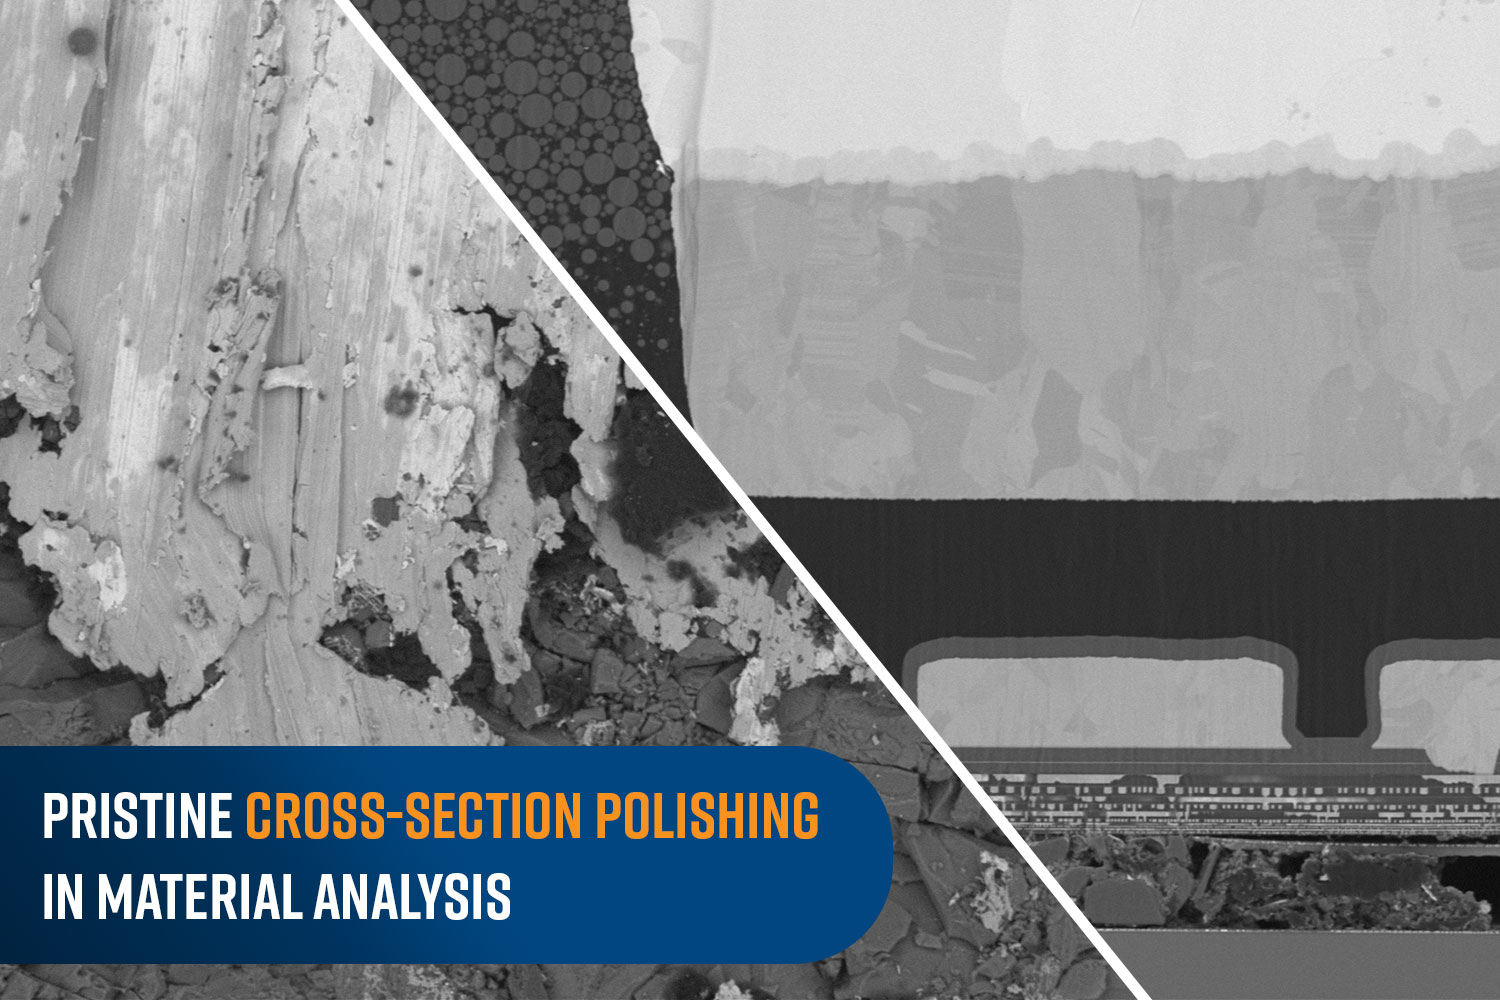
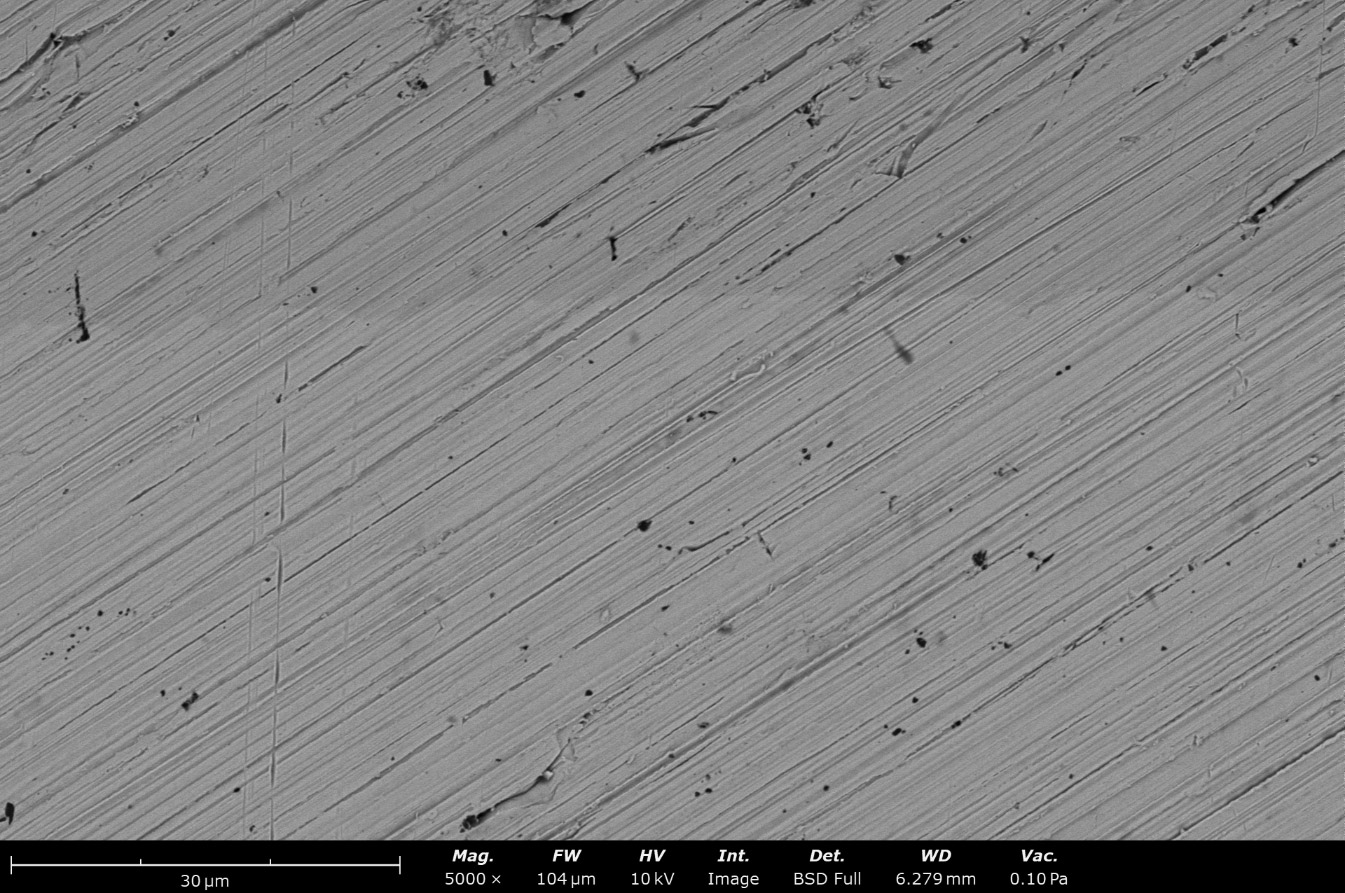
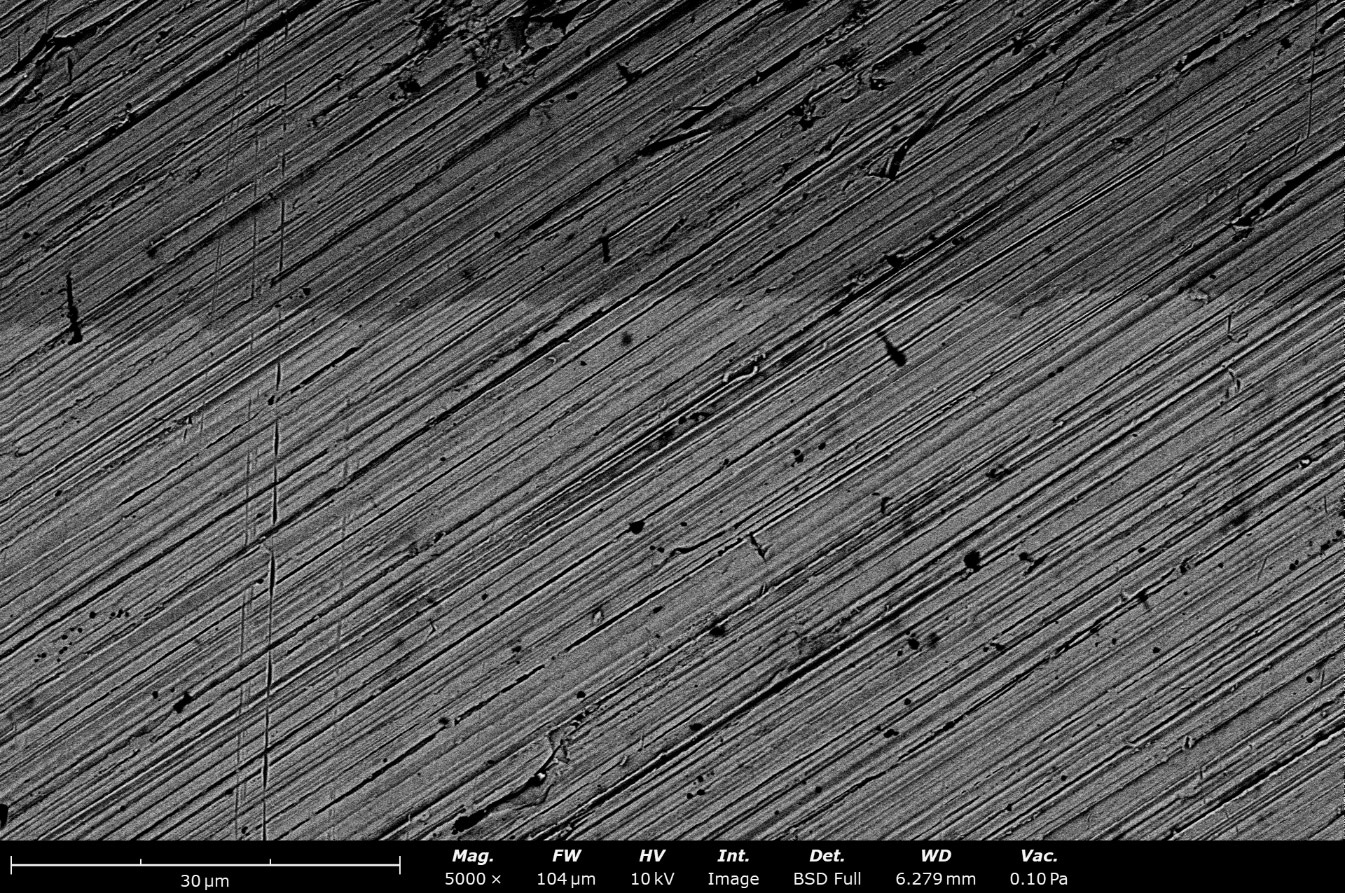
Figure 2 shows SEM images taken from the cross-section of a US 1-cent coin using a BSD detector. The cross-section contains an interface between zinc (Z = 30) and copper (Z=29). Without changing gamma (i.e., gamma = 1.0), the exact shape and location of the interface are difficult to detect due to the lack of contrast between the two regions. Applying a higher gamma value (i.e., gamma = 4.0) allows the contrast between these two regions to be enhanced, revealing the zinc-copper interface with more clarity and precision.
Grain Structure Analysis:
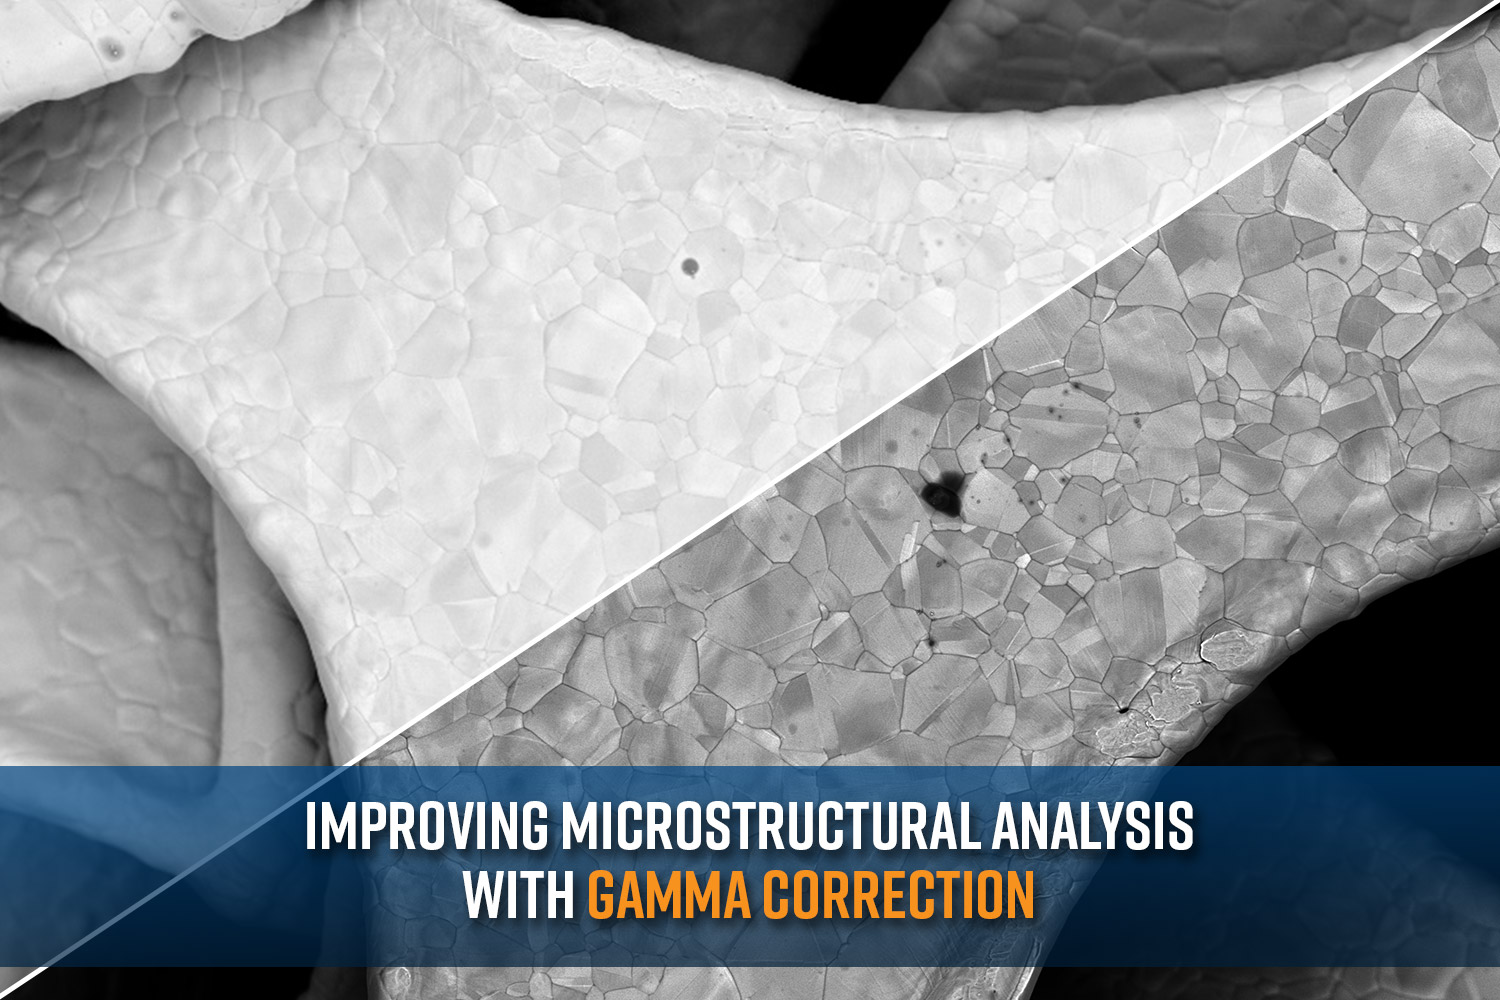
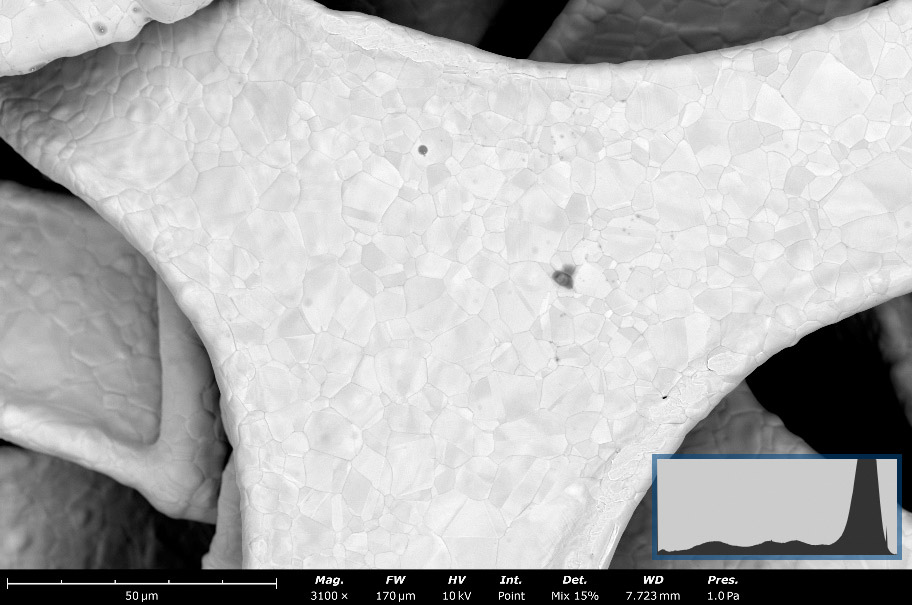
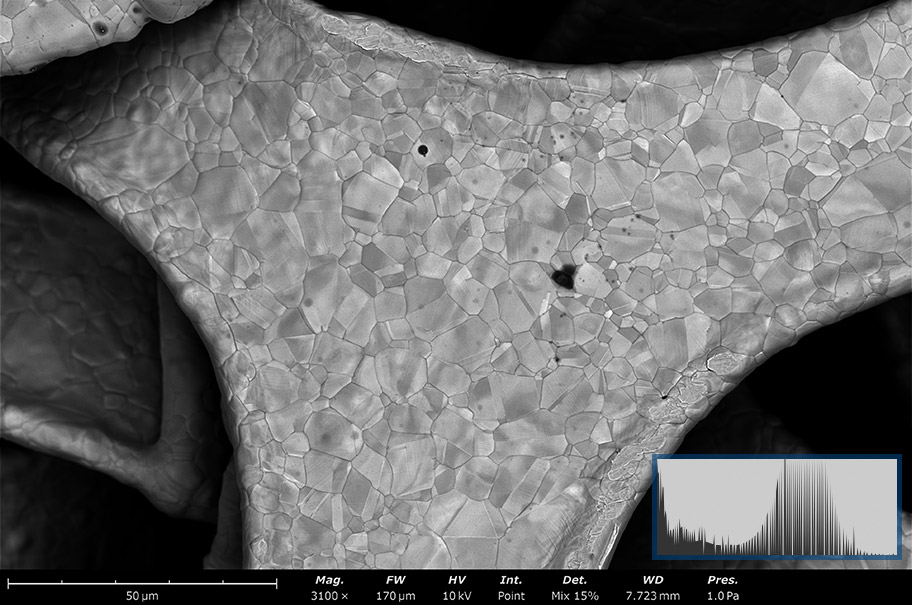
Gamma correction is especially beneficial when performing grain structure analysis of metals. In the following example (Figure 3), a piece of nickel foam is imaged using a 15%-to-85% mixture of the secondary electron detector (SED) signals and the BSD signals, respectively. The contrast seen in this image arises from varying diffracting conditions caused by the distinct crystal lattice orientations across the sample. These orientations can vary not only between grains but also within a single grain. In this case, detecting fine differences in contrast is needed to obtain a meaningful microstructural analysis.
Because the sample material is represented by a relatively narrow range of intensity values, contrast differences within the nickel foam are minimal, resulting in poor visibility of its microstructure even when automatic brightness and contrast adjustments are applied (Figure 3a). Decreasing the gamma value optimizes the visibility of the microstructure and reveals rich details, including the presence of multi-zoned grains that were not previously visible (Figure 3b).
Summary
Unlike brightness and contrast adjustments, which linearly alter all grayscale values across the image, gamma corrections modify the grayscale distribution in a non-linear manner. This non-linear adjustment enables precise control over contrast in a narrow range of grayscale values. Gamma correction is particularly useful in the BSD mode of SEM imaging, where it can enhance elemental differentiation and microstructural features. Fine-tuning the gamma value can reveal critical microstructural details that are less discernible with standard brightness or contrast adjustments alone. Such enhancements can lead to more accurate interpretations of SEM images in material science and related fields.