When choosing between two real-time, surface sensitive, and label-free technologies such as Quartz crystal microbalance with dissipation monitoring (QCM-D) and Surface plasmon resonance spectroscopy (SPR), it is important to understand what differentiates the two techniques. Both are used in surface interaction analysis to monitor specific interactions, molecular binding, adsorption and desorption events, and degradation. While the techniques are similar, there are also significant differences when it comes to information extraction/output and experimental capabilities. In this overview, we sort out the key differences and list examples of suitable scenarios for using each method.
What are your needs?
Comparing the two instruments, you will see a set of differences. Some of which are inherent in the measurement principle, and some which originate in the hardware design. Therefore, prior to deciding which method to use, you must define what information you need, and what capabilities are necessary for your experiments.
Which technique can deliver the answers you are looking for, and does the supplier of that technology offer all the possible features you need to run the experiments?
Differences and similarities in information output between QCM-D and SPR
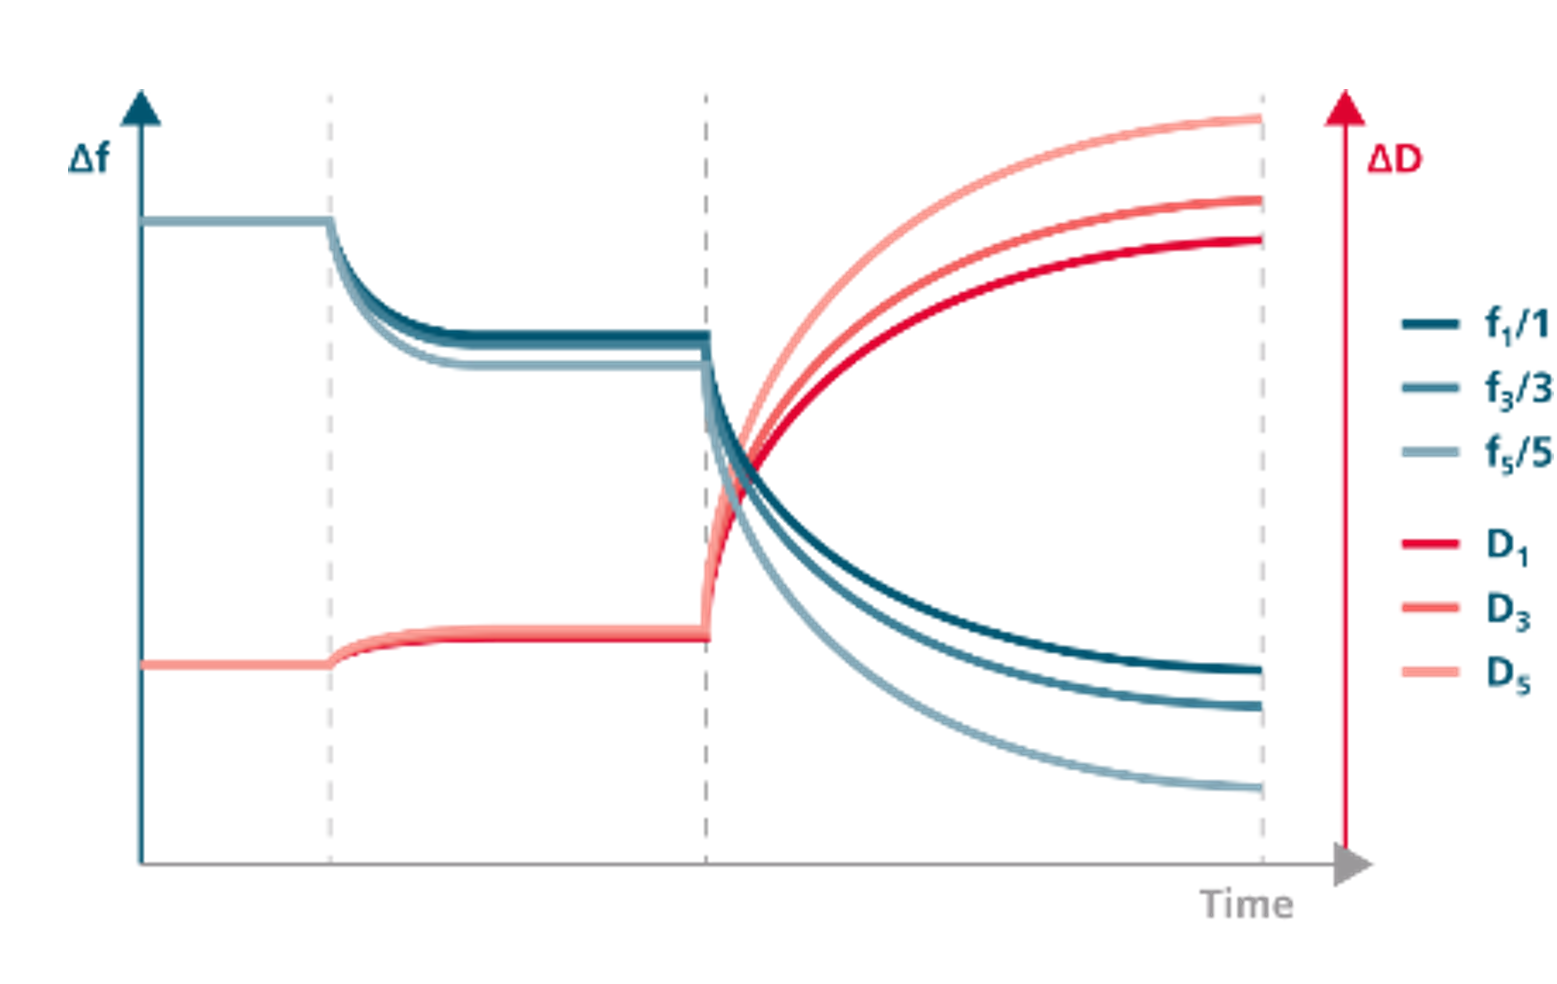
Starting with the respective technology and measurement principle, QCM (including the extended versions, QCM-D, QCM-I, QCM-A, etc.) is an acoustic technology, and SPR is an optical one. In brief, QCM measures resonance frequency changes, f, of an oscillating quartz crystal, while SPR measures changes of the surface plasmon resonance angle, ϴ. The resonance frequency of the crystal oscillation is sensitive to mass changes, and the SPR angle is sensitive to refractive index changes.
In addition to f and ϴ , some instruments capture additional parameters as well, expanding the amount of information extracted from each experiment. Depending on which captured parameters are offered by a specific QCM supplier, information output from QCM technology ranges from mere qualitative information about time-resolved mass changes at the surface, to quantitative information about mass, thickness, and viscoelastic properties at high time-resolution. The latter is the case for QSense® QCM-D, which is the QCM-setup that we will be referring to throughout this post.
Information output offered by a standard SPR instrument ranges from relative information about refractive index changes at/near the surface, to quantitative information about the refractive index, thickness, density, and surface coverage. Below we give examples of typical differences between the two technologies.
Examples of differences between QCM-D and SPR data output
QCM-D and SPR both, directly or indirectly, sense relative changes of mass coupled to the surface. However, the masses sensed are different, and are often referred to as ‘acoustic’ and ‘optical’ mass, or ‘hydrated’ and ‘non-hydrated’ mass. This is due to the physical principles by which the coupled mass is measured. The mass uptake estimate from SPR data is based on the difference in refractive index between the adsorbed material (e.g., biomolecules) and solvent (e.g., water) displaced by the material upon adsorption. This means that water associated with, for example, a protein film (i.e., the hydration shell) is essentially not included in the mass determination. In contrast, changes in frequency acquired with QCM-D measure water coupled as an inherent mass via direct hydration, viscous drag, and/or entrapment in cavities in the adsorbed film. Consequently, the SPR response is proportional to the coupled ‘molar mass’, while in QCM-D measurements, the layer is essentially sensed as a ‘hydrogel’ composed of the macromolecules and coupled water. The QCM-D mass can be calculated or modelled if the data and adsorbed layer fulfil the model requirements and conditions. The SPR mass can be calculated by multiplying the angle shift with a proportionality constant which is unique for the adsorbed species, and which must be calibrated independently [see ref 5, and references therein]
Both methods are indirectly able to characterize thickness changes. In QCM-D, the acoustic thickness is coupled to the mass via the layer density. In SPR, the response is proportional to the difference in refractive index between the adsorbate and the solution, and the optical thickness of the adsorbed layer. If the respective refractive indices are known, then the optical thickness can be calculated. Usually, instead of making the complicated conversion to adsorbed optical mass (see section above), the optical thickness is used as a measure of the adsorption. QCM-D, being an acoustic technique, allows measurement of thicker films, while SPR, being an optical technique, has greater limitations concerning the film thickness.
As discussed in the section about mass, QCM-D senses both molecules and coupled solvent while SPR only senses the molecules. Due to this characteristic, QCM-D will sense macromolecular reorganization and conformational changes via changes in water content— phenomena not detectable with traditional SPR. The coupled water sensed by QCM-D can also serve as signal enhancement, such as in small conformation changes where the amount of coupled solvent is significantly different between the conformational states.
While QCM-D measures two parameters, traditional SPR only measures one. The additional information contained in energy dissipation data from QCM-D enables a more detailed interpretation of the surface interaction and reaction processes. Changes in the dissipation are related to the shear viscous losses induced by the adsorbed layers, and thus provide information that can help identify structural differences between different adsorbed systems, or structural changes in the same type of molecule during the adsorption process. Layer properties and viscoelastic information related to conformation/structure/orientation can be characterized from the combined and data.
Both QCM-D and SPR monitor time-resolved mass changes, and have similar capabilities for evaluating kinetics from a technical point of view. However, due to the differences in what the methods sense, SPR technology is the stronger method in terms of kinetics and affinity characterization. Where QCM-D is more sensitive for water-rich and extended layers, SPR systems are very sensitive to refractive index changes near the surface, which is favorable in this context. In addition, SPR sample cells, in general, have a smaller volume than QCM-D sample cells, which is beneficial for mass transport. Thanks to this, SPR has become a standard technology for characterization of kinetic rate constants and affinity constants.
Experimental capabilities and hardware limitations
Just because measurements are possible in principle does not mean hardware is always set up to support them in practice. Instrument suppliers choose to package the technologies in different ways, optimizing for usability, footprint or other aspects. The experimental capabilities and potential limitations of the hardware design are, therefore, important to assess when deciding which experimental method to use. For example, are you able to mimic the relevant conditions such as surface material, solvent, and temperature? Can you afford the amount of sample required to run the set of experiments? The hardware design can both limit experimental possibilities, as well as open new opportunities.
Substrate
Where SPR essentially is limited to gold, dextrane, and biofunctionalized coatings, QCM-D sensor coatings are very versatile. The QCM-D electrode can be coated with essentially any material that can be applied as a thin, rigidly-attached layer. This enables surface interaction studies with not only biological surfaces, but also many other materials such as glass, plastics, and minerals.
Sample volume
Generally, the volume in the sample cell is smaller for SPR than for QCM-D. The minimum volume needed for an experiment is on the same order of magnitude for the two methods, see Table 1.
Solvents and temperature
Depending on what process or interaction is the aim of the study, there may be specific solvent requirements during the experiment. Many processes are also temperature dependent, so a certain temperature must be maintained throughout the experiment. In general, both technologies can handle solvent and temperature variations, and it is rather the specific instrument design and specifications that will be the limiting factor.
Measurement principle and hardware design
As already discussed, some of the differences between the two technologies are inherent in the measurement principle, while other restrictions stem from the hardware design. In table 1, we list a side-by-side comparison of typical information output, and hardware specifications to give a general idea of what can be expected from a QSense QCM-D and a standard SPR. Please note that the respective listed specifications may differ between instrument suppliers.
| QSense QCM-D | SPR | |
|---|---|---|
| Technology | Acoustic technique | Optical technique |
| Measured parameters | Shifts of frequency, f, and dissipation, D, at multiple harmonics of an oscillating quartz crystal | Shifts of plasmon resonance angle, ϴ 1 |
| Information output | QCM-D monitors time-resolved relative mass changes and layer softness, which provide info on: • Binding/adsorption/desorption/degradation • Uptake/removal rates • Conformational changes (swelling/crosslinking/collapse) When the model assumptions are fulfilled, it is possible to quantify absolute changes of: • Acoustic mass (incl. coupled solvent) • Thickness • Viscoelastic properties | Traditional SPR monitors time-resolved, relative refractive index changes (related to relative mass changes), which provides info on: • Binding/adsorption/desorption/degradation • Kinetic rate constants • Affinity constants • Concentration In certain situations, it can be possible to estimate or quantify [5]: • Thickness • Refractive index • Optical mass (i.e. molar mass) |
| Substrate material | • Versatile • In general, any coating that is thin and rigid can be used as a substrate material | • Noble metal is needed to excite the plasmons. Most SPRs use gold. • Thin coatings can be put on top of metal, but thick coatings or coatings with high refractive index will generally quench the signal as the evanescent field decays exponentially in the metal and dielectric media [1] |
| Medium | Gas phase and liquid | The technology as such works in both gas phase and liquid, but some suppliers have restricted the usage to only liquid |
| Dynamic thickness range | Typically, 10-10 m to 10-6 m The maximum thickness is limited by the penetration depth of the shear wave into the medium. | Typically, < 10-10 m to 2-3 ∙10-7 m The maximum thickness is limited by the exponential decay of the evanescent field. |
| Senses water content | Yes | No |
| Senses structural changes | Can sense structural changes of molecular layers, such as swelling, crosslinking, and collapse | Traditional SPR cannot sense structural changes. Some SPRs can sense swelling [3, 6] |
| Characterization of material properties | Yes | No |
| Kinetics | Can measure kinetic values however fluid exchange is not as rapid, and mass changes include associated solvent | A standard for measuring kinetic constants and affinity |
| Sample volume over surface | 15 – 40 µl | Typically, < µl – ~ µl [2, 3] |
| Min. sample volume per measurement channel | ~ 50 µl – 300 µl per channel | 2 – 5000 µl per channel [2, 3, 4] |
Which technology is right for my application?
Depending on what questions you are asking, and what your experimental needs are, one technology may be more suitable than the other. In Table 2, we list a few questions and experimental needs to guide you to which technology is the most appropriate for your application.
| If you would like to… | QSense QCM-D | SPR |
|---|---|---|
| Study binding | √ | √ |
| Study adsorption and desorption | √ | √ |
| Study degradation | √ | √ |
| Characterize hydrated mass | √ | |
| Characterize non-hydrated mass, i.e. molar mass | (√) | |
| Characterize layer thickness | √ | (√) |
| Characterize material properties (viscoelasticity) | √ | |
| Characterize conformational changes such as swelling, crosslinking, or collapse (i.e. molar mass unchanged) | √ | (√) |
| Quantify the number of molecules adsorbed/bound | √ | |
| Extract binding constants | √ | |
| Extract affinity | √ | |
| Quantify concentration | √ | |
| Use various substrate materials such as e.g. plastics, glass, or custom coatings | √ | |
| Use harsh solvents | √ | (√) |
| Work at high temperatures | √ | (√) |
| Limit sample consumption to maximum ~µl | (√) | √ |
Concluding remarks
QCM-D and SPR are two surface sensitive real-time technologies with overlapping application areas and which, at first glance, may appear seemingly alike. Similarities do exist, but there are also differences that may be critical depending on the scientific question asked, or the experimental needs. Overall, the acoustic QCM-D and optical SPR are complementary, but there are applications for which one or the other may be more suitable. In this overview, we have presented the key differences and the circumstances under which each technology is most suitable.
References
- S. Ekagasit, et. al., Applied Spectroscopy, 59, 5, 2005, p 661 – 667
- http://web.bf.uni-lj.si/bi/sprcenter/BiacoreT100.pdf
- http://www.bionavis.com/en/life-science/technology/traditional-spr/
- http://www.reichertspr.com/index.php?src=directory&view=systems&srctype=systems_detail_comparison-chart&refno=352
- Reimhult et. al., Anal. Chem, 76 (24) 2004, 7211-7220
- https://www.sprpages.nl/spr-over-view/spr-theory#ref4
Footnotes
- This is the parameter most commonly measured. There are, however, other ways to measure as well, listed in ref [6]