What is Electrochemical Impedance Spectroscopy (EIS)?
Electrical resistance is a well-known concept describing the ability of a circuit element to resist the flow of current. Ohm’s law describes the relationship between voltage (V), current (I) and resistance through a conductor as:
V=IR
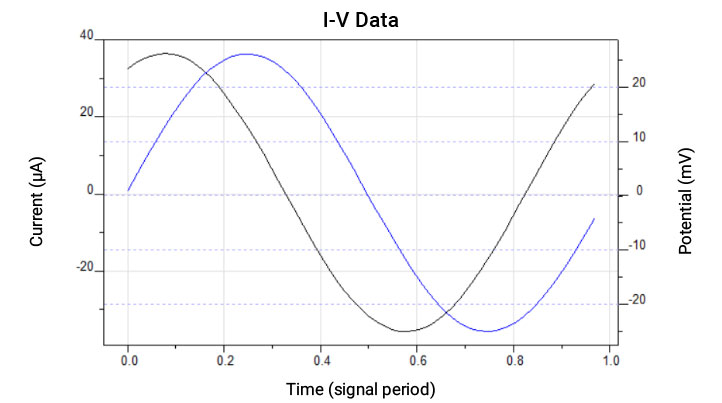
Figure 1: Current (black) and Voltage (blue) vs. Time plots for a Frequency in an Impedance Experiment. The voltage is shifted with respect to the current leading to a phase shift.
Real circuits involve many circuit elements and therefore exhibit a more complicated behavior. To investigate this, an alternating current (AC) over a wide frequency range is used and the opposition to AC is defined as impedance (Z). It is the AC equivalent of resistance but possesses magnitude and phase.
Impedance spectroscopy involves the application of a sinusoidal voltage (or current) signal to the circuit of interest and the measurement of the current (or voltage) response.
The applied AC voltage (E) is described by:
E(t) =E0sin(wt)
And the resulting current (I)
I(t) = I0sin(wt + φ)
Where w is the radial frequency and φ is the phase shift angle.
The analogous Ohm’s law relationship between E, I, and Z would be,
Z
=
E(t)
I(t)
Z
=
Z0
sin(wt)
sin(wt + φ)
Hence the impedance can be expressed in terms of the magnitude of the impedance, Z0, and the phase shift, φ.
Electrochemical Impedance Spectroscopy
Electrochemical reactions occur on different timescales and traditional direct current (DC) techniques may require an extensive series of experiments to provide a full picture. Alternating current (AC) methods can capture a broad range of timescales in one experiment, thereby electrochemical impedance spectroscopy (EIS) has become a fundamental research tool in electrochemical systems.
EIS is a technique for interrogating electrochemical interfaces and separating the processes occurring at different timescales. Sinusoidal signals at different frequencies are applied and the time-recorded response is measured to realize processes occurring at different time scales. Typically, the frequency of the signal is swept from high frequency to low frequency over many decades. At high frequencies from 8 MHz down to 250 kHz, electron movement in systems like semiconductors is probed, whereas at low frequencies from 1 Hz down to 10 mHz, diffusion behavior is elucidated. Reaction kinetics are probed in the intermediate frequencies (250 kHz to 1 Hz).
The EIS experiment involves applying a small (≤10 mV) sinusoidal voltage perturbation to the sample electrode in an electrochemical cell. This sinusoidal signal is superimposed on the DC voltage at which the reactions of interest are occurring. The current response is measured, and the impedance is calculated. This is repeated for many frequencies typically between 100 kHz and 0.01 Hz. The frequencies are spaced on a log scale for even coverage over the whole frequency range. A similar experiment can be performed in galvanostatic mode with a small AC current. In this case, you must be careful not to exceed the small voltage perturbation limitation with the applied current.
Analysis of EIS data is performed with respect to equivalent electrical circuit elements, resistors, capacitors, and inductors. In addition, electrochemists have devised other elements that more closely describe the behavior of the electrochemical system that do not have electrical equivalents such as Warburg elements for diffusion, and elements that describe porous behavior.
Criteria for valid impedance measurements
The 3 main criteria for valid impedance measurements are that the response is linear, stationary, and causal.
A linear system is one in which a doubling of the sinusoidal perturbation yields a doubling of the response. Electrochemical systems are typically non-linear and hence, small voltage excitations are used to approximate a linear system.
The electrochemical system ideally is required to be stationary so that the measurements made at the start of the experiment and the end of the experiment correspond to the same experimental conditions. In practice, electrochemical systems are pseudo-steady states and longer time-scale experiments can be challenging.
A measurement is causal when the measured response of a system only comes in response to the applied changes.
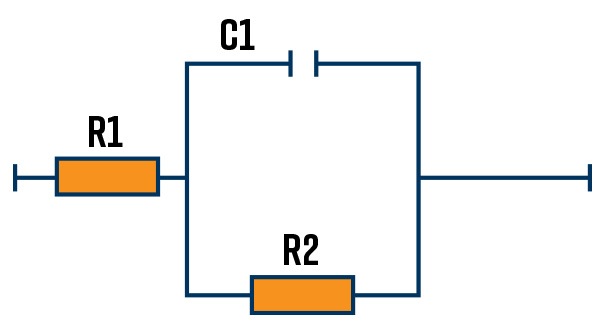
Simplified Randles Cell
The simplified Randles cell is a common model to represent a metal interface in an electrolyte solution where an electrochemical reaction is taking place. The solution resistance is in series with a charge transfer resistance and double-layer capacitance in parallel. The simplified Randles cell is often used as a starting point to analyze complex impedance data. The model can be seen in Figure 2.
Figure 2: Schematic Representation of a Simplified Randles Cell
Representation of impedance data
The 2 main ways of representing impedance data are:
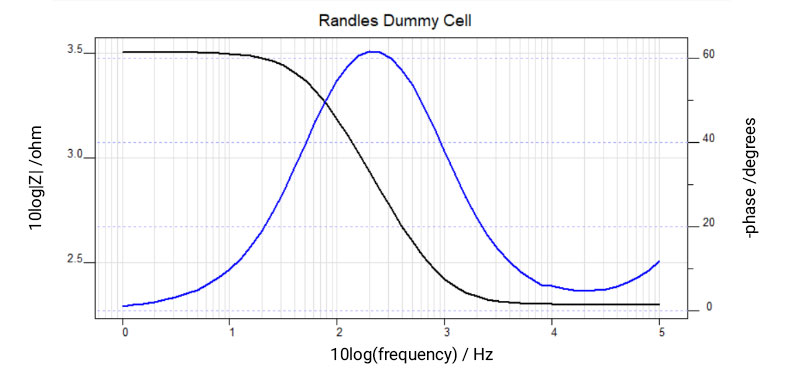
Bode plot where the log of magnitude and phase of the impedance is plotted against the log of the frequency.
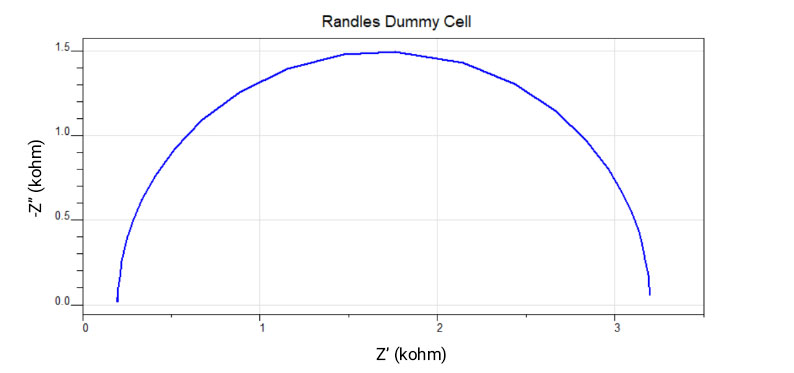
Nyquist plot where the real impedance is plotted against imaginary impedance.
The same impedance data recorded on a simplified Randles dummy cell is shown in Figure 3, as both the Bode plot and Nyquist plot. This model assumes that the electrode surface is homogeneous and that the reaction rate is the same across the electrode. Each plot type has advantages and disadvantages, the bode plot explicitly shows the frequency and identifies small impedances in the presence of large impedances but can be difficult to interpret more complicated behaviors. The Nyquist plot does not explicitly show frequency and it is difficult to identify small impedances in the presence of large impedances, but it can be easier to identify complex behavior.
Figure 3. Impedance Spectroscopy data was recorded on a simplified Randles dummy cell. Bode plot (left) and Nyquist plot (right) of the exact same data is presented.
Interpreting Data
One of the most common ways of interpreting impedance data is using equivalent circuit models. The electrochemical interface behaves like resistors and capacitors in series and parallel. In addition, electrochemists have developed other modeling elements to explain the behavior in different reaction regimes.
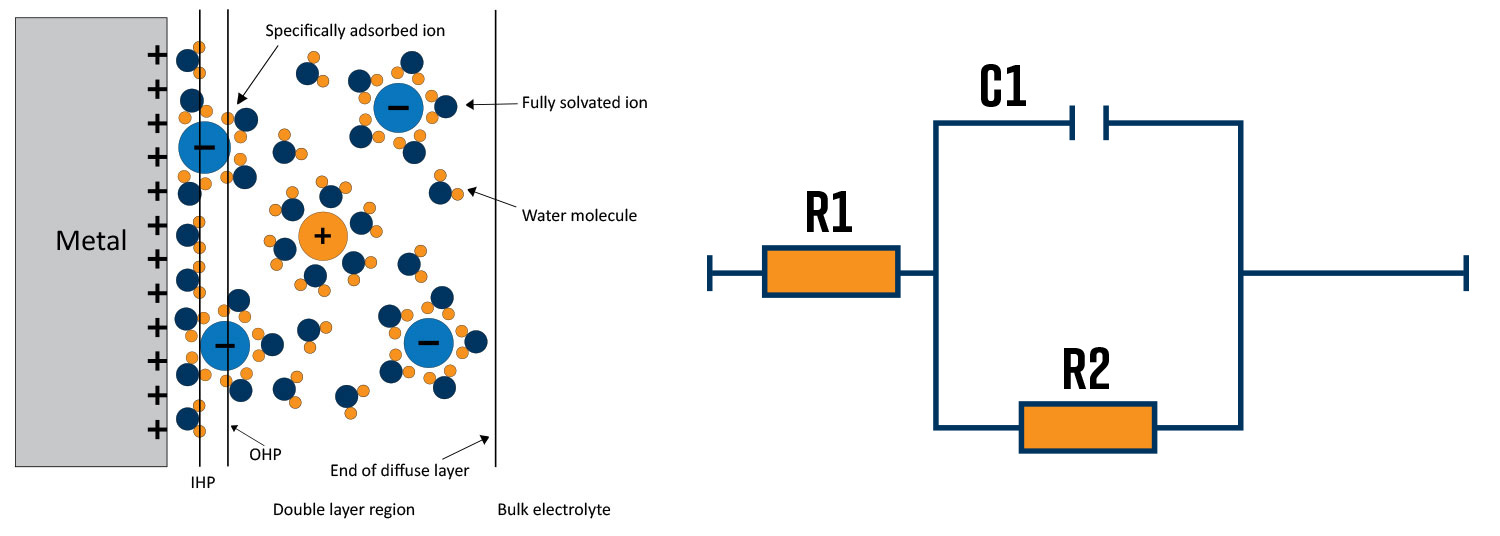
Figure 4. Schematic of the metal /electrolyte interface (A) and equivalent circuit (B) representing an electrochemical reaction occurring at a metal surface.
An example of a metal/electrolyte interface is shown in Figure 4a. In this case, the metal surface has a positive charge which attracts negative ions to the surface and repels positive ions from the region close to the surface. The ions close to the surface are separated from the metal by a thin layer of water molecules. The region close to the metal surface mimics a capacitor with the 2 charge surfaces separated by a dielectric. Figure 4b shows the equivalent circuit that describes the metal/electrolyte interface in Figure 4a. R1 describes the solution resistance, C1 describes the interfacial capacitance and R2 describes the charge transfer resistance of a reaction happening at the surface.
Examples of EIS applications
Battery Testing
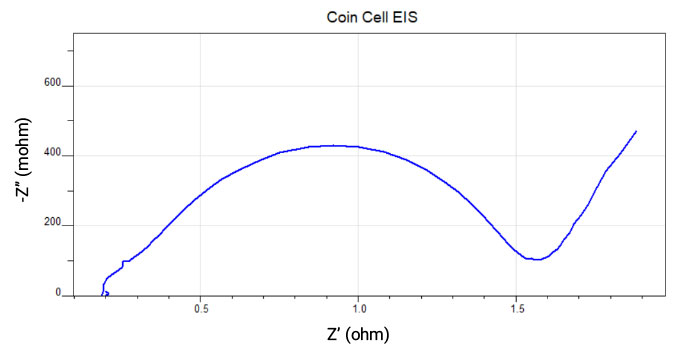
EIS is an important additional tool for testing batteries. Information about the ESR (equivalent series resistance) and the reaction rates of the individual electrodes can be extracted through circuit modeling. Diffusion in Lithium-ion batteries can also be probed.
Figure 5: Nyquist impedance plot of a coin cell battery.
Paint-coated Electrodes
Impedance spectroscopy is a sensitive technique for following the degradation of coated metal surfaces. The large difference in dielectric constant between water and the polymer coating means that even very small changes in the surface can be detected.
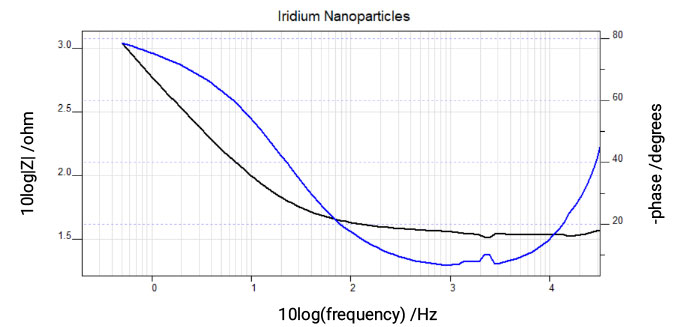
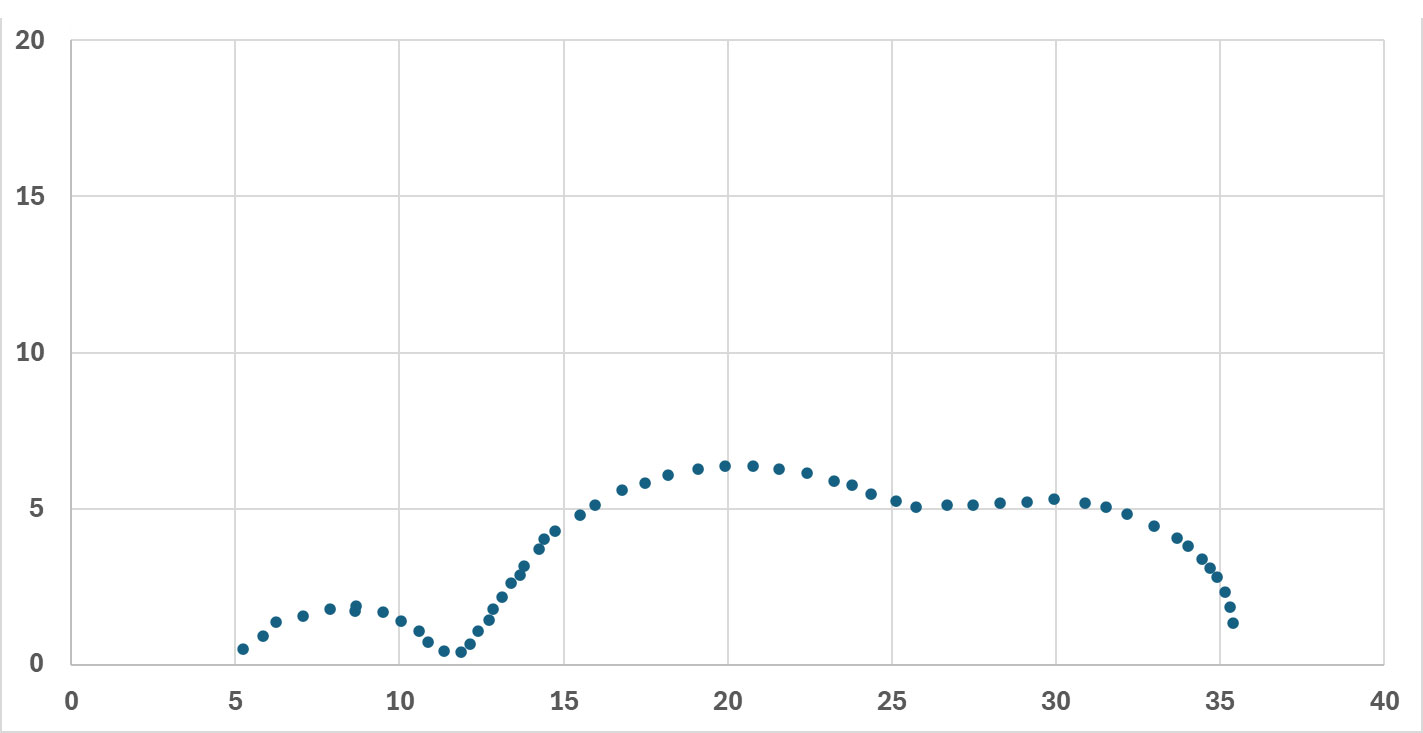
Figure 6. Bode plot of Iridium Nanoparticles on a Glassy Carbon electrode in 0.1 N H2SO4
Electrocatalytic Surfaces
Impedance measurements of electrocatalytic nanoparticles on electrode surfaces is shown in Figure 6 and can indicate the electrochemical surface area of the particles for comparison between different preparation methods and use in the calculation of activity.
Corrosion
Electrochemical impedance can be used to study corrosion behavior, specifically corrosion reaction rates as well as reaction rate differences with the introduction of inhibitors. Inhibitors are commonly used to protect steel infrastructure like pipelines from internal corrosion.
Fuel cells and Electrolyzers
Fuel cell stacks consist of several individual fuel cells placed in series. The performance of the whole stack as well as individual cells can be assessed by electrochemical impedance spectroscopy simultaneously while the fuel cell is operating. Differences related to the position in the stack can be evaluated.
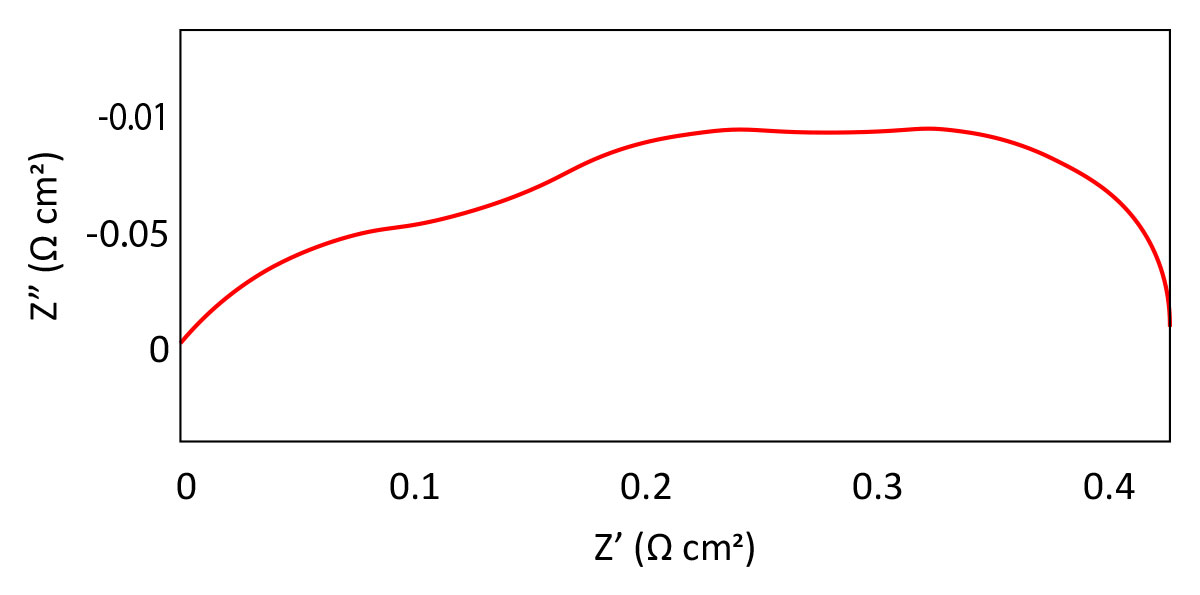
Figure 7. Impedance spectrum of a Fuel Cell
Figure 8. Solar Cell impedance spectrum for a Dye Sensitized Solar Cell
Photovoltaics
Photovoltaic cells are made up of nanostructured and mesoporous layers which can be probed by Electrochemical impedance spectroscopy due to the distinct timescales of reactions that occur in these structures.