Scanning electron microscopy (SEM) is an extremely versatile analytical technique that produces high-resolution images by scanning a focused electron beam across a sample surface. Within the SEM, multiple detectors capture different signals generated through beam-sample interactions so that surface morphology and elemental composition can be visualized at nanometer resolution.
The superior resolving power of SEMs with respect to optical microscopes makes them an indispensable tool for almost all industries, especially those involving micro and nanoscale materials. Many organizations are considering bringing this powerful technique in-house with desktop SEMs to increase accessibility, lower costs, and speed up time-to-data. Some common applications include microelectronics R&D, forensics, medical devices, batteries, general manufacturing, geology, and drug development.
SEM Workflows
Implementing SEM into your unique environment requires making an important choice as to what workflow is going to bring the most value to your project. SEM workflows can be classified into three categories: manual, semi-automated, and fully automated.
Manual

Performing the SEM workflow manually requires a user to collect one or more SEM images and then inspect the image for features to analyze. This process is usually repeated several times on a single sample to obtain statistically robust data. Manual processes require a skilled operator to identify, collect images and measure the features of interest. The user would then have to manually acquire an EDS spectrum to gather the elemental composition of the feature. While it might be tedious for a single sample with a small number of features, manual analysis can quickly become exhausting, leading to user fatigue and error-prone when multiple samples or features require analysis. Manual processes are low throughput and susceptible to user bias that can affect the accuracy and reliability of the technique.
Semi-automated (2 ways)

or

The semi-automated workflow focuses on either automating the data collection or image analysis component, thereby improving the accuracy and overall throughput of the technique. In the case of automated data analysis, the SEM user manually acquires several images and imports them into the image analysis software. The software allows the user to modify settings and thresholds which determines how it will detect features and what measurements will be made on each feature. Automating the feature detection and analysis can yield a much higher number of data points for a single image. Some common examples of feature measurements include X, Y dimensions, aspect ratio, size distribution, porosity, and concentricity. Unique features of interest can then be relocated and additional analysis such as EDS analysis can be performed to identify and characterize the feature. In the case of automated data collection, hundreds of images can be collected in relatively short periods. Automation of data collection will increase throughput, remove user bias and potentially eliminate the need for an expert user to operate the SEM. The data analysis, which would be manual, would still be the bottleneck.
Fully Automated
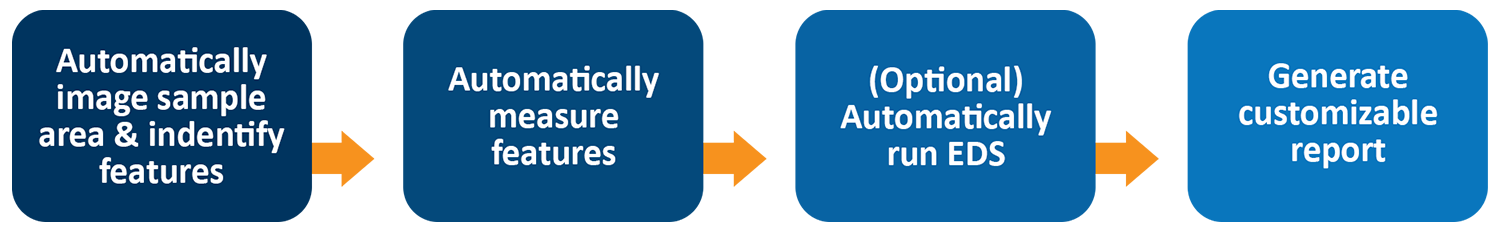
A fully automated workflow expands the automation to cover both data collection and analysis, making it possible for an unskilled user to acquire accurate data in a short period of time. Once the sample is loaded and the operator initiates the pre-defined recipe, the SEM will automatically scan the sample to identify features. The features are seamlessly measured according to the predefined recipe. As an optional step, because the software and SEM instrument are integrated, they can decide if EDS analysis is run as well. This can either be performed on all or only certain features (e.g., features that are elongated or above a certain diameter). With full automation in place, high throughput data collection is possible while simultaneously analyzing the data and generating customized reports. This allows for real-time data-based decision-making.

How to select the right level of automation for your SEM workflow:
Choosing the right level of automation for your project is not a one size fits all approach. Some important aspects to consider are how many individuals will use the SEM and what level of skills or experience they possess. It’s also critical to think about how the SEM will be used. Is the instrument being used for routine analysis, like quality control? Do you expect a variety of different samples and projects, such as in failure analysis? How should data be collected and analyzed to obtain statistically robust data sets?
For example, if your SEM is used in an environment where there are no expert SEM operators and several samples have to be analyzed in real-time, then opting for a fully automated workflow would ensure speed and reliability regardless of the operator performing the analysis. If you have already collected several SEM images but are struggling to get statistically significant data, opting for a semi-automated approach that focuses on streamlining the image analysis will be beneficial.
The Phenom Desktop SEM has options for manual, semi-automated, and fully automated workflows. The standard SEM software allows for full flexibility in data collection and analysis in a manual workflow. The use of the Phenom Programming Interface (PPI), which is based on the Python programming language, can easily automate both data collection and analysis. The built-in Prosuite software includes automated data analysis for fibers, particles, and pores. ParticleX is a fully automated solution for Phenom XL Desktop SEMs that combines automated SEM imaging, feature detection, quantitative and chemical analysis, plus customized reporting all in an easy-to-use interface. ParticleX is also fully customizable. The user can develop their workflows for data collection, thereby increasing throughput and making it more accurate and repeatable. Data analysis can also be automated with customized rules thereby developing predefined recipes to accurately detect and analyze features of interest. Customized reporting templates can also be developed to meet standardized reporting structures. Particle X also includes several predefined routines for the detection of gunshot residues (GSR), detection and analysis of non-metallic inclusions in steel, analysis of NCM powder (nickel, cobalt, manganese) in battery research as well as cleanliness in the automotive, aerospace and other industries with critical component parts.