PHENOM SEM AUTOMATION
ParticleX Battery
ParticleX Battery for the Phenom XL Desktop SEM is a versatile solution for high-quality, in-house structural and chemical analysis of battery materials. It supports production and development teams with fast in-house analysis, verification, and classification of materials. The software automates data collection and analysis of SEM and EDS data, allowing a wide user base to generate high-quality, actionable data for improving quality and functionality of battery materials.
High-Throughput
Analyze up to 10,000 particles per hour with SEM-EDS without needing a skilled operator.
Particle-Specific Data
Size, shape, composition, and position of every detected particle is recorded, allowing you to revisit any location for further analysis.
Standardized Reporting
Maintain consistency in quality control testing across manufacturing sites with customizable pass/fail reporting.
Talk to an Instrumentation Specialist Today!
In-house Analysis of Battery Materials
In battery manufacturing, precise analysis of active materials like NCM (nickel-cobalt-manganese or Ni-Co-Mn) powders is crucial for ensuring high-performance lithium-ion batteries. The particle size distribution of NCM powders directly influences battery efficiency, while even trace impurities can lead to severe device failures. To effectively detect contaminants and maintain batch-to-batch consistency, high-resolution scanning electron microscopy (SEM) combined with energy-dispersive X-ray spectroscopy (EDS) is essential.
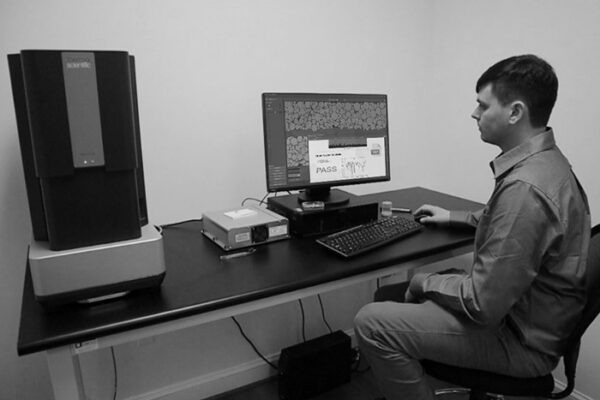
An increasing number of battery manufacturers are transitioning from outsourced analysis to in-house SEM capabilities. This shift is driven by solutions like ParticleX Battery for the Phenom XL Desktop SEM: a powerful, ready-to-use tool designed for rapid material analysis, authentication, and classification. By integrating this system into production workflows, manufacturers gain fast, accurate, and reliable data to enhance quality control and optimize performance.
ParticleX Battery
Product Features
Flexible applications
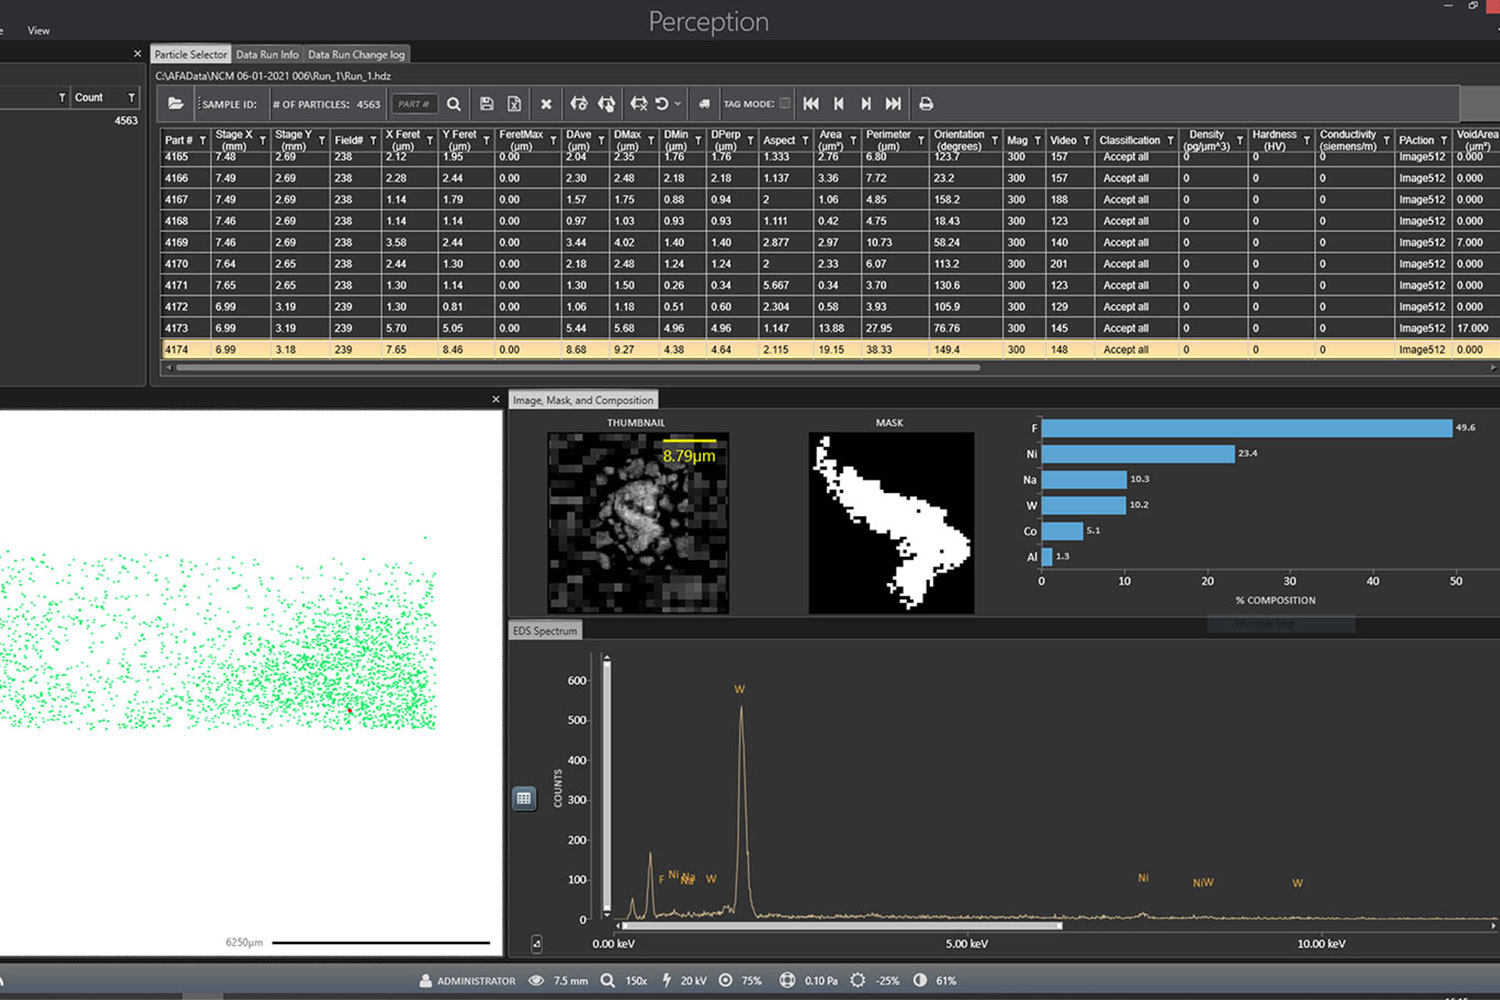
ParticleX Battery equips the Phenom XL to automatically scan samples, identify particles of interest, analyze each particle’s composition using EDS, and compiles all acquired data into templated reports for quick and easy interpretation. The classification rules for summarizing results can be customized and used for all kinds of battery analysis applications, including:
- Monitoring powder purity and environmental cleanliness level in production floor
- Detection and characterization of contaminants in electrode tapes
- Identification of needle-in-a-haystack “killer” particles based on conductivity classification
Analyzing the morphology and composition of battery materials, such as precursor cathode active material (pCAM), reveals important insights into battery performance. Particle agglomeration or poor crystal orientation in the pCAM can be significantly detrimental to battery properties like charge capacity and charge/discharge rates. With ParticleX, particles can be automatically sized and classified, identifying potential problems in the earliest stages of battery development.
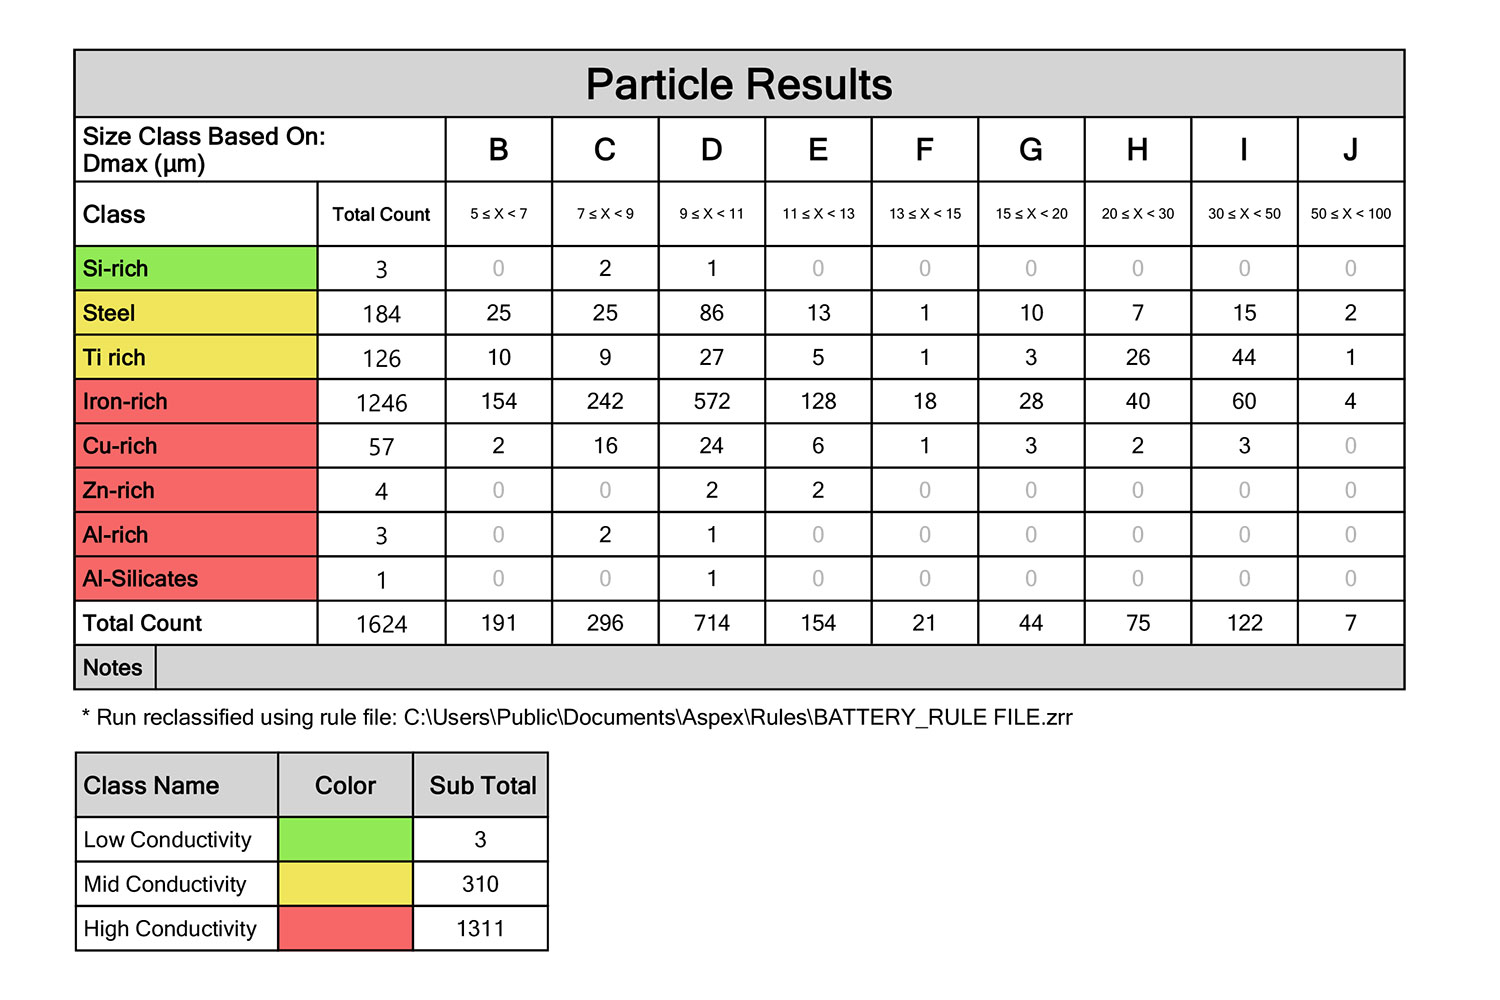
Classification based on conductance
By assigning a conductance value to each particle class, particles can be systematically sorted and categorized based on their conductivity risk level. This enables a more precise evaluation of contamination impact, distinguishing between less critical organic contaminants and high-risk metallic foreign particles. Combined with the ability to revisit detected particle locations, this screening method allows for the identification of “killer” particles, enabling in-depth imaging and EDS analysis to uncover root causes and mitigate potential failures.
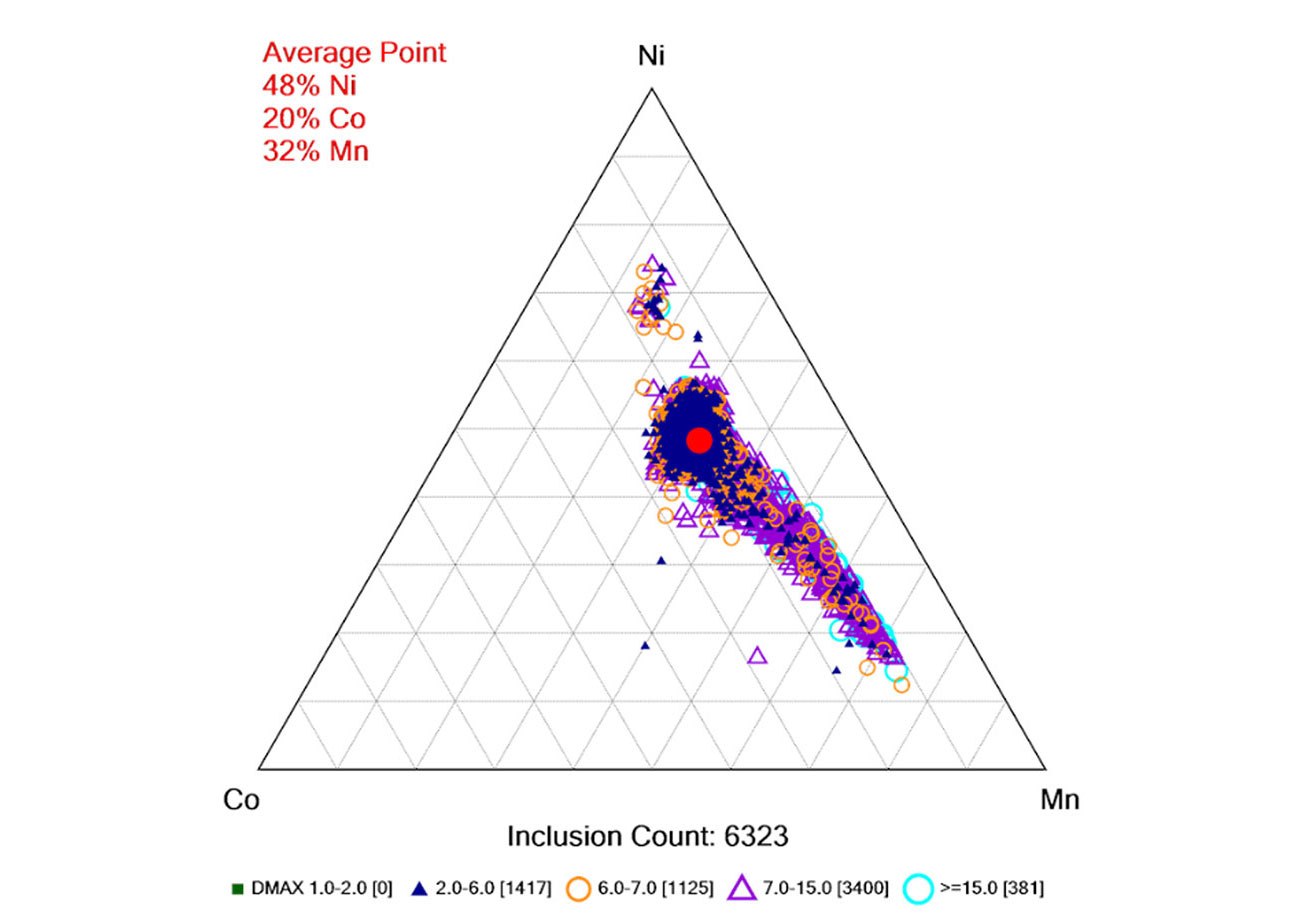
Ternary Diagrams
Ternary diagrams provide a powerful, intuitive way to visualize within-batch compositional variations and reveal correlations between particle size and composition. These diagrams are invaluable for assessing NCM powder quality, condensing vast amounts of data into a single, insightful representation. By analyzing them, manufacturers can quickly identify outliers, detect trends across batches, and evaluate the impact of different processing conditions with ease.
ParticleX Battery
Product Knowledgebase
Automating Battery Materials Analysis using Avizo Trueput with Phenom Desktop SEMs
Battery manufacturers face increasing demands for higher throughput, reproducible quality…
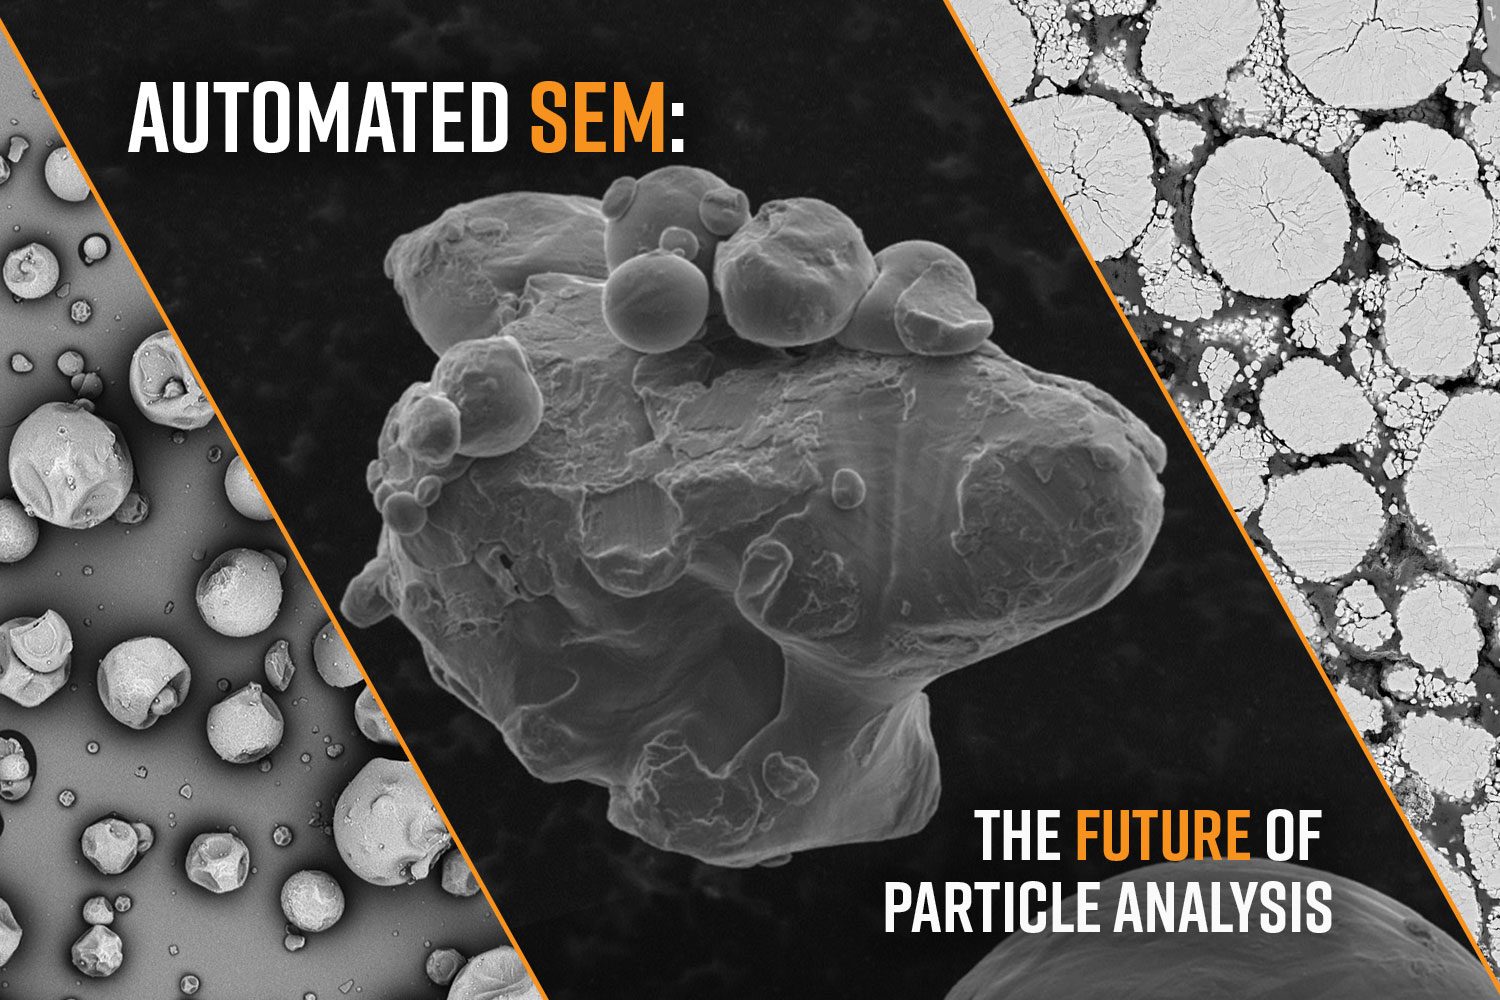
Automated SEM: The Future of Particle Analysis
Particle analysis involves characterizing the size, morphology, and composition of powders…
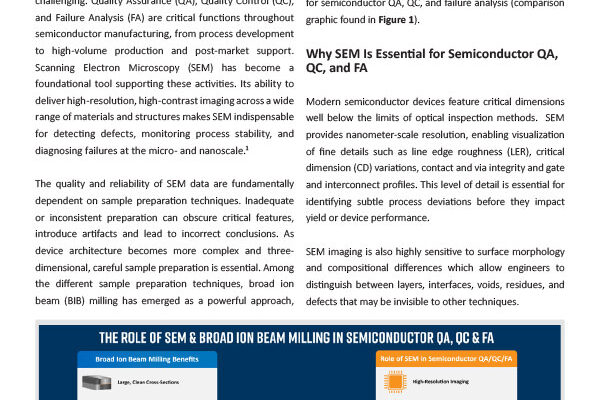
SEM & BIB milling for QA, QC, and Failure Analysis in Semiconductor Devices
Introduction As semiconductor devices continue to scale in complexity and shrink in featur…