Table of Contents
What is Contact Angle (CA)?
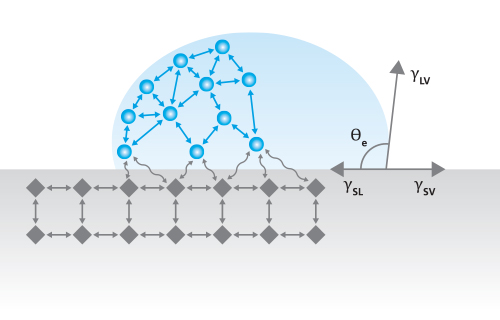
Contact Angle, θ, is a measurement that quantifies the wetting of a solid by a liquid. It is defined geometrically as the angle formed by a liquid at the three-phase boundary point where a liquid, gas, and solid intersect. The well-known Young Equation describes the balance at the three-phase contact of solid, liquid, and gas.
γSV = γSl + γlv cosθY
Equation 1
The interfacial tensions, γlv (surface tension of the liquid), γsl (the interfacial tension between solid and liquid), and γsv (the surface tension of the solid i.e. surface free energy), form the equilibrium contact angle of wetting, many times referred to as Young’s contact angle, θY, represented in Figure 1.
The simplest and most common Contact Angle measurement is the sessile drop, or static contact angle, which is measured with an optical tensiometer, also known as a contact angle goniometer or drop shape analyzer [1]. In a sessile drop contact angle measurement, a drop of liquid (typically water) is placed on the surface of the sample of interest and the contact angle is measured without moving the droplet. Calculating the contact angle between the droplet and surface using Young’s equation necessitates several assumptions about the surface, as it only applies to ideal surfaces [2]. These assumptions include:
- The surface is smooth
- The surface is rigid
- The surface is chemically homogeneous
- The surface is insoluble
- The surface is non-reactive.
Because samples violate at least one of these assumptions in practice, the measurable contact angle is technically a range of stable contact angles that exist for the surface based on factors such as chemical homogeneity, topography, and roughness. To capture the entire range of angles for a sample surface, dynamic (advancing and receding) contact angles are measured. The difference between the advancing and receding contact angles is called the contact angle hysteresis. Dynamic contact angle can also be measured using force tensiometry, which will be elaborated upon later in this article.
What is Wettability?
Wettability refers to the tendency of liquids to spread across a surface of interest. It is commonly characterized by using water as the probe liquid for a static contact angle measurement. In general, surfaces on which the liquid tends to spread out, forming a flatter droplet, are described as having good wetting or high wettability. Surfaces on which liquid tends to “ball up” are described as having poor wetting or low wettability. In practice, these wettability categories are related to specific ranges of contact angle measurements, as defined in the diagram in Figure 2.
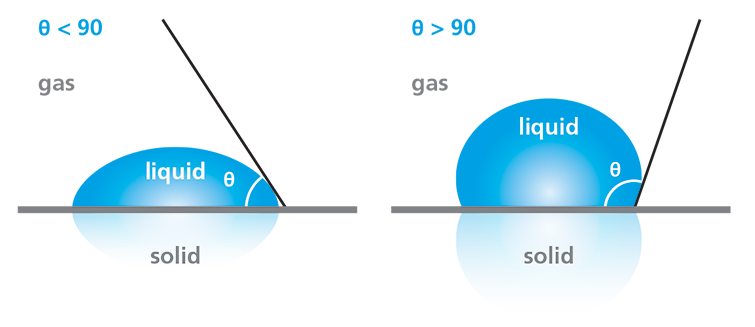
Water contact angle measurements enable the determination of a surface’s hydrophilicity or hydrophobicity, which is often critical to assessing the success of surface treatments or cleaning processes. If the water droplet spreads across the surface, resulting in a contact angle of less than 90°, the surface is considered hydrophilic. Conversely, if the water does not tend to spread, resulting in a contact angle of greater than 90°, the surface is considered hydrophobic.
What are the Contact Angle measurement methods?
There are multiple types of contact angle measurements, which reveal different information about a surface and its properties. While the static or sessile drop contact angle is the most common contact angle method, it does not provide the full picture of a surface’s chemical or topographical homogeneity since it only characterizes the singular location where the droplet is placed [3]. Additional contact angle methods help to quantify other characteristics of the surface and allow measurements on specialty samples with irregular topography, shape, or dimensions. Other measurements related to Contact Angle such as Surface Free Energy of solids and Surface and Interfacial Tension of liquids will be discussed elsewhere.
Static Contact Angle
Static Contact Angle, also referred to as Sessile Drop Contact Angle, is the simplest and most common contact angle method. This measurement entails using an optical tensiometer to place a drop of liquid and capture images of the droplet sitting stationary on the surface. The images are then fit with an appropriate algorithm, typically based on Young’s equation, to determine the contact angle between the droplet and solid. Thanks to how quick and easy this measurement is to execute, static contact angle is a popular method used across many industries and fields of research, ranging from industrial cleanliness assessments to printing, petroleum, and medical devices, among many others.
Batch Contact Angle
Batch Contact Angle is another term used to refer to a group of static contact angle measurements carried out on various locations of the same sample. This is particularly useful for industrial quality control, where quality management systems require the testing of a certain number of samples from each production run. Besides surface cleanliness, which is a concern across several industries, batch contact angle measurements also provide valuable information about the success of surface treatments, proper adhesion of paints and other coatings, and many other applications. Batch contact angle measurements are also useful for adherence to industrial and regulatory standards related to surface properties.
Advancing and Receding Contact Angle (Dynamic Contact Angle)
The speed and simplicity of contact angle measurements make them suitable for many applications, but these simple measurements provide limited information about the surface. In some instances, more detail is necessary, which is where dynamic contact angle measurements fill the gap.
The Young’s angle that is the theoretical basis for contact angle measurements represents the lowest energy equilibrium state between the solid, liquid, and gas phase of a drop of liquid on a surface [3]. As mentioned previously, there are five assumptions made regarding the surface when calculating Young’s angle, of which, at least one is violated by a sample surface in any given experiment. Thus, the actual measurable contact angle is a range of contact angles. In particular, surface heterogeneities, such as roughness or chemical differences, can allow liquid drops to exist in a number of metastable states [3]. A real-life example of this would be the differences in the shape of water droplets on a car after it rains. Even if the car is clean, the drops of water would form different angles on the surface due to potential differences in the finish, roughness, tilt, etc. Similarly, static drops only provide limited information about the behavior of a surface because these drops are much more likely to exist in these metastable states, as opposed to a global lowest-energy state.
One way to provide more context into real surfaces is by measuring advancing and receding contact angles. These measurements are referred to as dynamic contact angles, or quasi-static contact angles. There are multiple ways to measure advancing and receding contact angles with either optical or force tensiometry, depending on the size, shape, and properties of the solid sample. We will also briefly discuss contact angle hysteresis and how the hysteresis value can be interpreted.
How Do You Measure Advancing/Receding Contact Angle Using Optical Tensiometry?
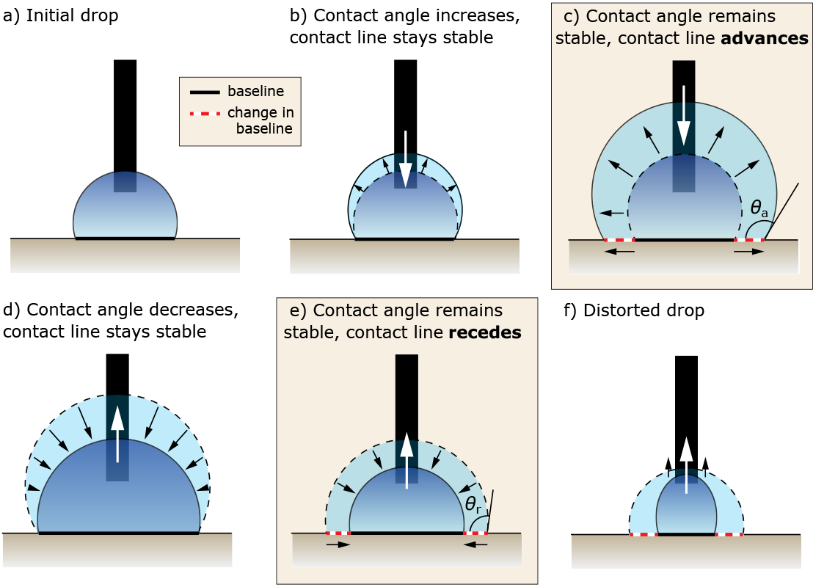
When the sample is a suitable size and shape for mounting on an optical tensiometer stage, the needle-in method can be used to measure advancing and receding contact angle, which is summarized in Figure 3. The needle-in method is executed by placing a droplet of liquid on the surface, moving the needle into the droplet, and steadily injecting liquid to increase the volume of the drop. Initially, as the drop volume increases, the contact angle increases, and the baseline (the point where the drop contacts the sample) is stable. As more liquid is pumped into the droplet, the contact angle will stop increasing and reach stability, while the baseline will begin to advance on the surface. At this point, the advancing contact angle (ACA) has been reached.
The receding contact angle (RCA) is made in the opposite way, where liquid is removed from a static droplet. Initially, the drop volume and contact angle will decrease, but the baseline will remain stable. Eventually, the contact angle no longer decreases and will stabilize once again. The RCA is reached when the contact angle stabilizes and the baseline length decreases or begins to recede. The difference between the advancing and receding contact angle is called the contact angle hysteresis.
What is Contact Angle Hysteresis?
A perfectly homogeneous surface has a theoretical contact angle hysteresis of 0°. Larger hysteresis values are typically associated with larger amounts of surface heterogeneity, and vice versa. Common causes of hysteresis include roughness and chemical heterogeneity. Additionally, a large hysteresis value indicates a low drop mobility [2]. It is possible for a seemingly hydrophobic material to exhibit a large contact angle hysteresis, which suggests high adhesion of a drop to the surface. Korhonen et al. show an example of such a material [4].
How Do You Measure Advancing/Receding Contact Angle Using Force Tensiometry?
Dynamic contact angle can also be measured with the Wilhelmy Plate method using a force tensiometer. For a detailed introduction to the Wilhelmy Plate method, read the Tensiometry Technique Overview.
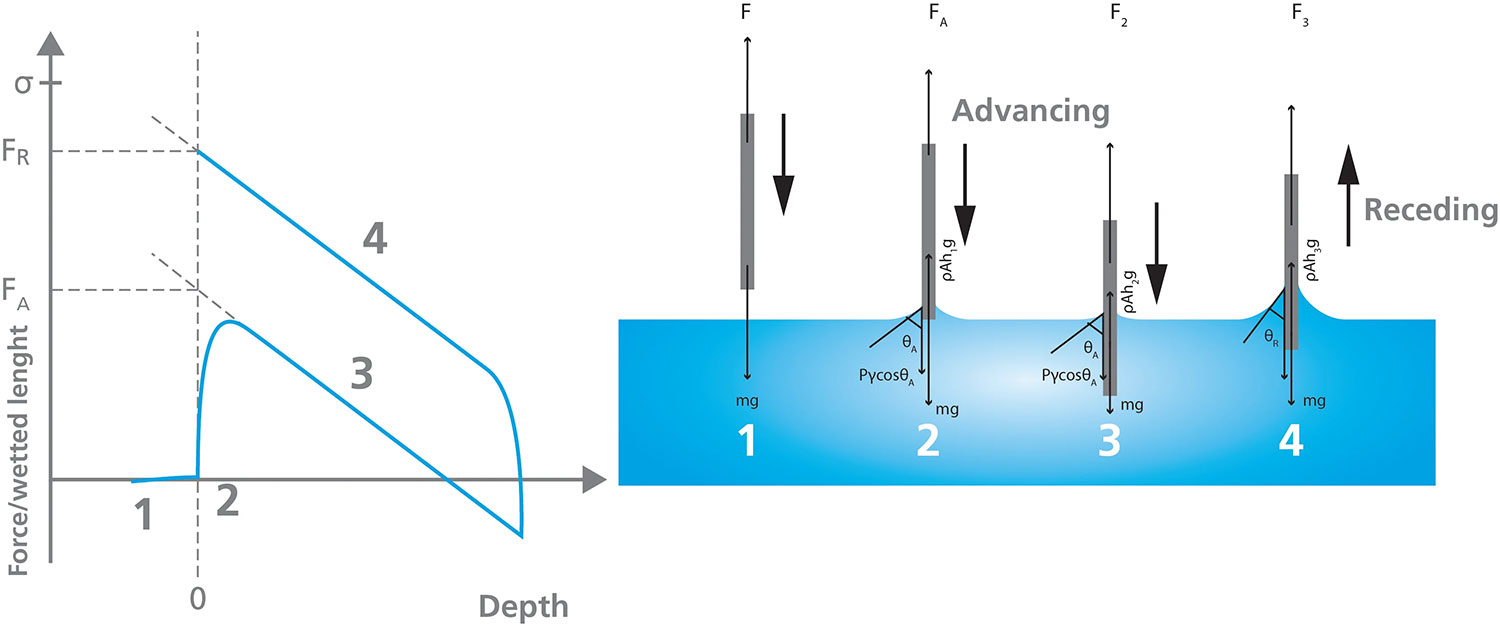
Figure 5 depicts the stages of a Wilhelmy Plate dynamic contact angle measurement. When the plate is attached to the tensiometer, the mass of the plate is the only force measured by the balance. The balance is zeroed (visualized as Stage 1 in Figure 5) before lowering the plate towards the liquid vessel until it touches the surface of the liquid, labeled Stage 2. As the plate is lowered further into the liquid, the wetting force, the mass of the plate, and buoyancy act on the plate, netting the force measured during Stage 3. The plate is then withdrawn from the liquid to collect the receding measurement, as shown in Stage 4. Using linear regression of the advancing and receding force curves at zero depth (depicted in the Force/wetted length vs. Depth plot) allows the calculation of the advancing and receding angles.
This method of measuring dynamic contact angles can only be used if certain parameters are known, including the surface tension of the liquid, and the sample/plate perimeter. Additionally, the sample must be uniform in shape and the surface must be homogeneous on both sides to ensure the contact angle is consistent over the area that is immersed in the liquid.
Advantages of Measuring Advancing and Receding Contact Angle
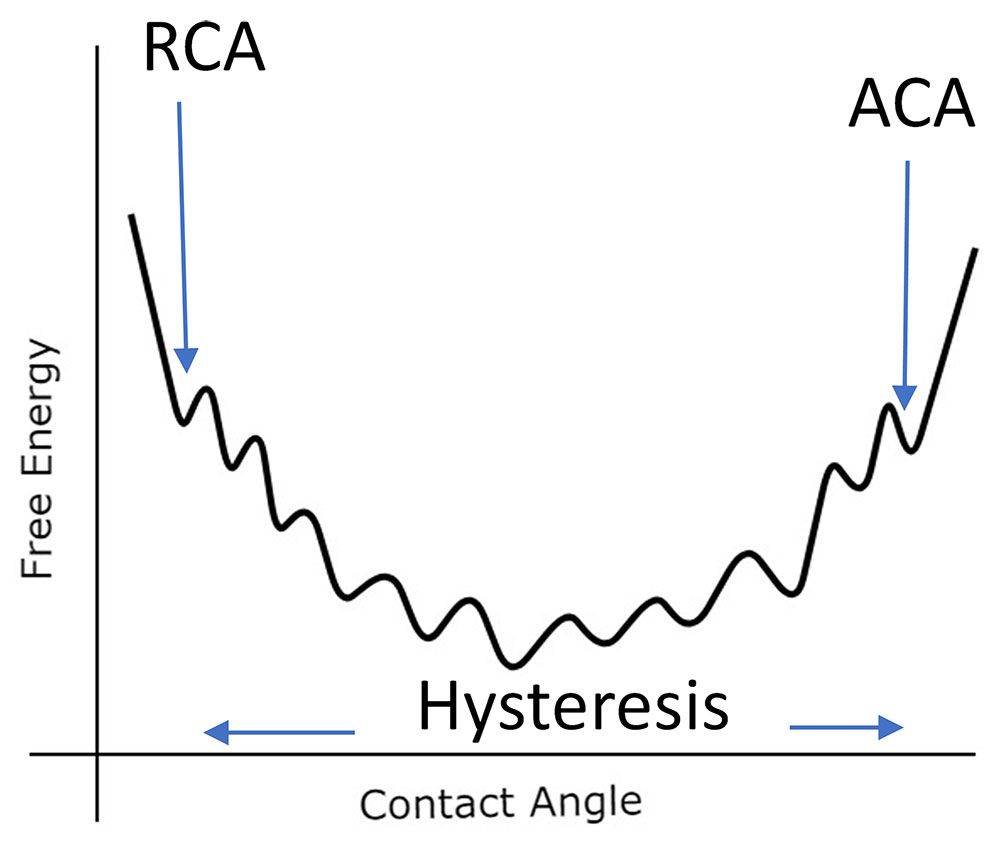
There are several advantages of measuring advancing and receding contact angles. One is that the ACA and RCA tend to overcome many of the metastable free energy spots in the contact angle range. This is illustrated in Figure 4.
In effect, the advancing contact angle is the largest contact angle in the free energy range, while the receding contact angle is the lowest contact angle in the free energy range. Because of this, these measurements are theoretically the most reproducible. Secondly, the hysteresis value provides information about the surface heterogeneity and how much liquid adheres to the surface [4]. Third, when measuring a static drop, evaporation and/or drop volume may affect the contact angle. When a drop is advanced or receded across a surface, these issues become irrelevant. Finally, superhydrophobic surfaces by definition require ACA and RCA values greater than 150° [4]. Also, a common purpose of these surfaces is to resist adhesion, a parameter directly related to hysteresis.
An excellent overview of how to make contact angle measurements is given by Huhtamäki et al [1]. The authors provide details on how to perform these measurements on many different types of surfaces as well as how to analyze the data.
Tilting Contact Angle/Roll-Off Angle
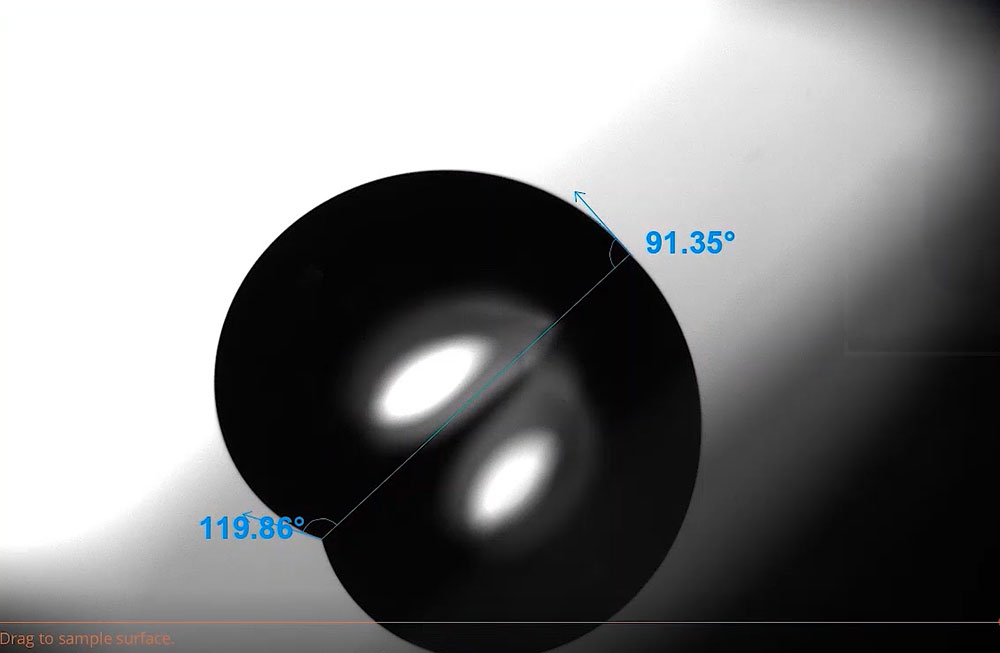
Tilting angle measurements provide information about the adhesion conditions of a droplet on a surface. They are performed by using either a tilting cradle or a tilting stage to physically rotate a substrate and droplet. As the drop rotation increases, gravity will pull the droplet downward until it eventually rolls off the substrate, and the tilting angle is measured at the point where the drop starts moving. The leading edge of the drop is called the advancing contact angle, while the trailing edge is called the receding contact angle.
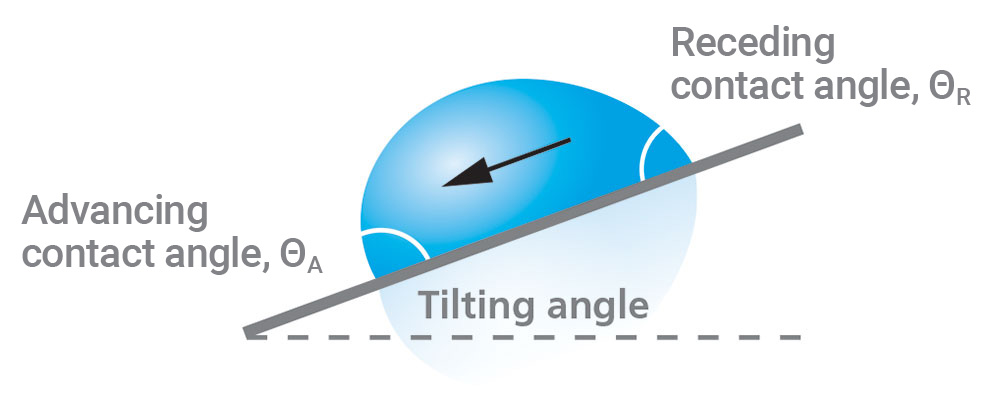
Figure 6 illustrates the droplet characteristics of a typical tilting contact angle measurement, and Figure 7 shows an example of an actual tilting contact angle measurement. The difference between the advancing and receding angles is the hysteresis. Highly uniform samples will have a small contact angle hysteresis and low roll-off angle. Even surfaces that are hydrophilic can be manufactured to have low hysteresis and low roll-off angles [5].
One potential point of confusion is that the terms advancing, receding, and hysteresis are also commonly used for the needle-in method. While the results obtained for the two measurements are related, they are not the same. One main difference between these two measurements is the fact that the results obtained for the tilting angle measurement depend on the drop volume. As the drop volume used for the measurement increases, the advancing and receding contact angles tend to converge. Conversely, differences between the advancing and receding contact angles tend to be larger at small drop volumes [6].
Corrected contact angle – How topography in real-life samples can affect your measurements
Contact angle measurements are widely used in research, production, and quality control fields. The Young’s contact angle of a material, which is usually the value reported in literature, assumes an ideal surface that contains no roughness, contaminants, chemical heterogeneity, or interactions with the probe liquid. As mentioned previously, in reality, one or more of these assumptions may be violated for any given experiment. In particular, roughness has a well-known effect on contact angle, where increasing amounts of surface roughness tend to enhance the existing properties of the material. For research in understanding the fundamental properties of a coating, plastic, or ceramic, these roughness effects may be unwanted and could produce misleading data regarding the material’s true properties.
In 1936, Robert Wenzel developed a relationship between the Young’s contact angle, surface roughness, and the corrected contact angle [7]:
cosθm = r * cosθy
Equation 2
Where θm is the measured contact angle, θY is the Young’s contact angle, and r is:
r = 1+ Sdr/100
Equation 3
The Sdr is defined as the additional percentage in surface area contributed by surface roughness and can be measured using a device such as a profilometer or atomic force microscope. The Sdr of a completely flat surface is 0. Its calculated value per ISO 25178 [8] is:
Sdr |
= |
1 |
[ |
∬A |
(√ |
[ |
1 + |
( |
ðz(x,y) |
) |
2 |
+ |
( |
ðz(x,y) |
) |
2 |
] |
- 1 |
) |
dx dy |
] |
||
A |
ðx |
ðy |
|||||||||||||||||||||
Equation 4
Where A is the definition area.
An integrated system that contains both a contact angle goniometer and a profilometer could potentially perform both a Sdr measurement and contact angle on the exact same spot on a sample. Instruments like the Attension Theta Flow with Roughness-Correction are capable of these types of simultaneous measurements, using a motorized XYZ stage to accurately move between where the topography measurement is being performed and where the contact angle droplet is placed.
The Attension Roughness-Correction module utilizes a fringe projection phase-shifting method where a projector generates a sinusoidal fringe pattern on a sample and the movement of the fringes is captured with a camera. The setup of this type of measurement is illustrated in Figure 8. In this system, the sinusoidal fringes can be described by the equation:
ln (x, y) |
= |
a + b cos |
( |
2𝜋x |
+ ø0 + δn |
) |
|||
p |
|||||||||
Equation 5
Where x and y are the position coordinate, a is the background intensity, b is the amplitude modulation, p is the sinusoidal grating wavelength, ϕ0 is the phase shift due to the surface height, and δn is the phase shift from the slide movement. The intensity of each pixel varies as a function of height, and using a software algorithm, topographical information such as the Sdr, root mean square (RMS) roughness, average height, minimum and maximum height, and other parameters can be determined in 2D and 3D. More details about the fringe projection phase shifting method can be found from Zhang and Peisen [9].
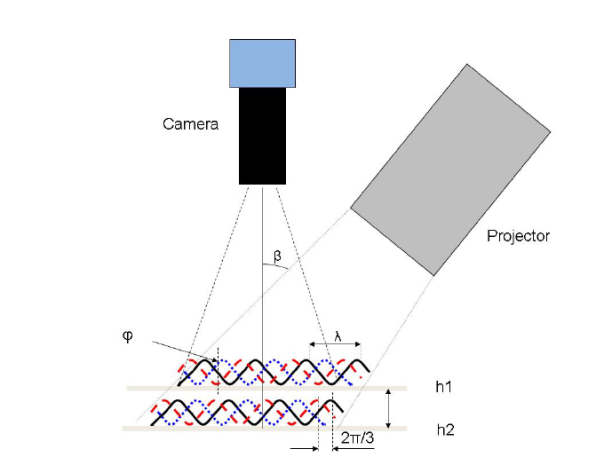
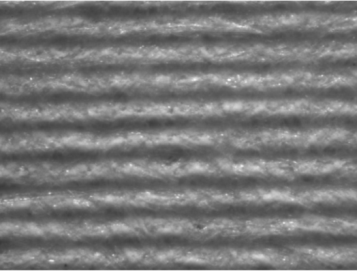
Figure 8: Schematic of a fringe-projection phase shifting measurement and its corresponding optical surface
Contact Angle of Special Samples
Although contact angle measurement is often straightforward, there are some cases that require careful experimental design. A few special cases include fibers, powders, samples with extremely small surface areas, and samples that absorb liquid.
How is Contact Angle measured on Small Surface Areas?
In a standard sessile drop measurement, a droplet of a few microliters in volume is deposited onto a sample surface and is imaged by an optical camera. The image of the droplet is than analyzed by software to determine the contact angle between the droplet and the baseline surface material. As the droplet sits on the surface, it usually creates a baseline width from around 1 millimeter to a few millimeters, depending on the wettability properties of the surface material. In most cases, this baseline width is suitable, and several measurements can be taken on the same sample. However, in some situations, contact angle measurements must be performed on much smaller surfaces. There are now tensiometers that are capable of dispensing smaller droplets to make contact angle measurements on these small surfaces possible. One such instrument is the Attension Theta Pico, which uses piezo-driven inkjet printing technology to consistently dispense droplets as small as 20 picoliters, resulting in droplet diameters of less than 100 µm.
How is Contact Angle measured on Fibers?
Fibers and other thin objects can be measured by an optical tensiometer equipped with a picoliter dispenser or with a force tensiometer using the Wilhelmy plate method. With an optical tensiometer, the picoliter dispenser can produce droplets with the base diameter of about 30 to 50 µm. With special optics and a high speed camera, it is possible to take an image of this small droplet. Contact angle can then be determined in a similar fashion as microliter drops. A force tensiometer, on the other hand, can be used by utilizing a special holder for the fiber. Due to extremely small forces exerted to the balance, an anti-vibration table and cabinet are required for reliable measurements. Both of these methods are reviewed in further detail in this application note:
How is Contact Angle measured on Powders?
Contact angles on powders can be measured by using sessile drop measurements on a compressed powder tablet or by using a force tensiometer with the Washburn method. When compressed tablets are measured, it can behave like the absorbing substrate if the powder is hydrophilic or the droplet can stay on the surface if the powder is hydrophobic. The Washburn method is thoroughly explained in this application note about measuring the contact angle, surface free energy, and wettability of powders.
How is Contact Angle measured on absorptive, hydrated, or porous samples?
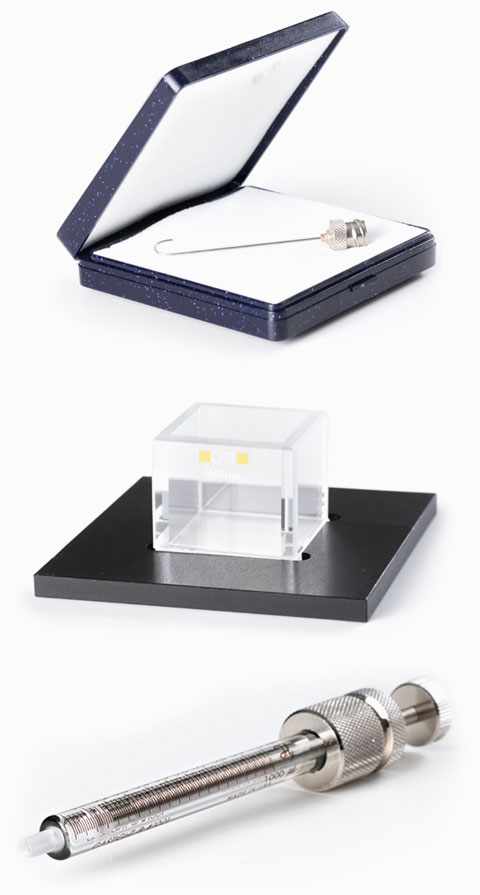
Measuring contact angles on highly wetting or absorptive surfaces is problematic because water droplets may not reach a measurable equilibrium value before disappearing or going to 0°. One may also want to characterize a material that has underwater or hydrated applications in its use case environment such as with contact lenses. Because standard contact angle measurements are not feasible in these two situations, an alternative measurement one can make is a captive bubble measurement. In this setup, the sample is hydrated in liquid and a hooked needle is used to deliver an inverted air bubble or immiscible liquid onto the sample.
Captive bubble measurements
Captive bubble measurements are an alternative way to make measurements on absorptive, hydrated, or porous samples. A hooked needle filled with air is placed below the sample and a bubble is dispensed onto the surface. Analysis of the bubble contact angle is performed in the same way as a traditional measurement with liquid drops, with the exception that the baseline is above the drop instead of below it [10]. The contact angle obtained can be directly related to the water contact angle with the equation θL=180∘-θB.
References
[1] Huhtamäki, T., Tian, X., Korhonen, J., & Ras, R. H. A. (2018). Surface-wetting characterization using contact-angle measurements. Nature Protocols, 13(7), 1521–1538. https://doi.org/10.1038/s41596-018-0003-z
[2] A. Marmur, “Thermodynamic Aspects of Contact Angle Hysteresis,” Advances in Colloid and Interface Science, vol. 50, pp. 121-141, 1994.
[3] Kwok, D. Y., & Neumann, A. W. (1999). Contact angle measurement and contact angle interpretation. Advances in Colloid and Interface Science, 81(3), 167–249. https://doi.org/10.1016/s0001-8686(98)00087-6
[4] J. T. Korhonen, T. . Huhtamäki, O. . Ikkala and R. H. A. Ras, “Reliable Measurement of the Receding Contact Angle,” Langmuir, vol. 29, no. 12, pp. 3858-3863, 2013.
[5] Cha, H.; Vahabi, H.; Wu, A.; Chavan, S.; Kim, M.-K.; Sett, S.; Bosch, S. A.; Wang, W.; Kota, A. K.; Miljkovic, N. Dropwise Condensation on Solid Hydrophilic Surfaces. Sci. Adv. 2020, 6 (2), eaax0746.
[6] Pierce, E.; Carmona, F. J.; Amirfazli, A. Understanding of Sliding and Contact Angle Results in Tilted Plate Experiments. Colloids Surf. Physicochem. Eng. Asp. 2008, 323 (1–3), 73–82.
[7] R. N. Wenzel, “Resistance of solid surfaces to wetting by water,” Industrial & Engineering Chemistry, vol. 28, no. 8, pp. 988-994, 1936.
[8] International Organization for Standardization, “Surface Texture: Areal—Part 2: Terms, Definitions and Surface Texture Parameters,” International Organization for Standardization, Geneva, 2012.
[9] S. Zhang and P. Huang, “High-resolution, real-time 3D shape acquisition.,” 2004 Conference on Computer Vision and Pattern Recognition Workshop. IEEE, p. 28, 2004.
[10] Prydatko, A. V.; Belyaeva, L. A.; Jiang, L.; Lima, L. M. C.; Schneider, G. F. Contact Angle Measurement of Free-Standing Square-Millimeter Single-Layer Graphene. Nat. Commun. 2018, 9 (1), 4185.