Emulsion Stability in Droplet-Based Microfluidics
There are a lack of tools to efficiently predict emulsion stability. Stabilizing emulsions is a significant problem in foods [1], personal care products [2], pharmaceuticals [2], and droplet-based microfluidics. Some major applications of droplet-based microfluidics include single-cell gene sequencing [3], anti-body screening and drug discovery [4], and synthesis of functional nanomaterials [5]. In these applications, single droplets encapsulate materials such as single cells, and the droplets must remain stable and not coalesce or else the analysis or reactions can be ruined. This is complicated by the fact that droplets often must incubate for long times, cycle through several temperatures such as in PCR, and often contact each other. The choice of filler fluid, droplet phase, and additives in either heavily influences drop stability, but making the best choice of components is not trivial. Interfacial tension measurements are commonly made, but these are poor predictors of drop stability. Instead, often formulations are simply run through the microfluidic system to see if they are successful. This can not only take a long time, but the materials can be expensive and limited.
Interfacial dilatational rheology has been shown to influence emulsion stability, particularly drop coalescence and Ostwald ripening [6], and the pulsating drop method, or oscillating drop method, has become a powerful technique for measuring interfacial dilatational rheology in the past couple of decades [7,8]. The technique builds on the well-established pendant drop method which is part of the axisymmetric drop shape analysis (ADSA) family of techniques [9]. The pendant drop volume oscillates, causing the interfacial area to regularly compress and dilate which likewise compresses and dilates the adsorbed film at the liquid-fluid interface. The response in interfacial tension to changes in the area of the drop allows for calculating the interfacial dilatational elasticity and viscosity.
An Interfacial Dilatational Rheology Case Study with the Attension Theta Flex
In a customer case study, the Attension Theta Flex optical tensiometer with a PD200 pulsating drop module was used to measure interfacial dilatational rheology for quality control (QC) of microfluidic device filler fluids. In this application, aqueous droplets are used to encapsulate single cells for sequencing and other bioassays. Changes in the oil or aqueous phase formulations have been identified as causes of failure in the microfluidic system, and a reliable and cost-effective QC method is needed. The previous QC method involved testing the real microfluidic system with different formulations, which was expensive and time consuming. As an alternative, we demonstrate that interfacial elasticity measurements using the pulsating drop method is a time- and cost-effective quantitative QC method for distinguishing successful and poor-performing systems.
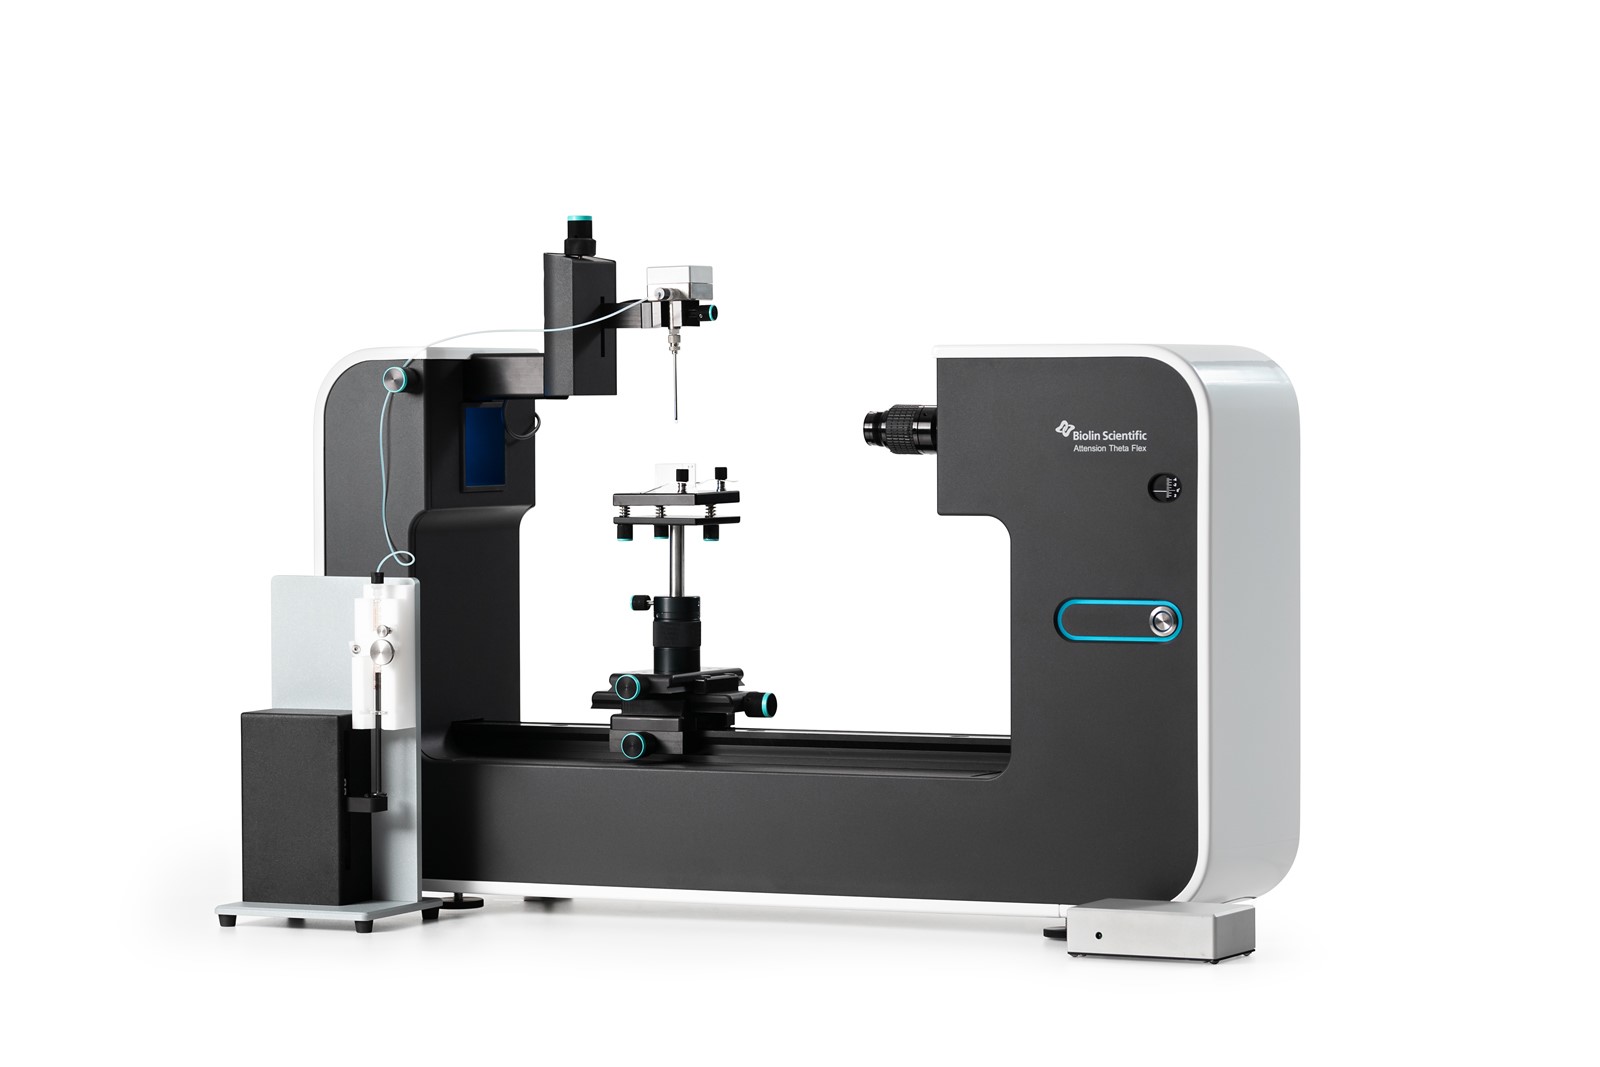
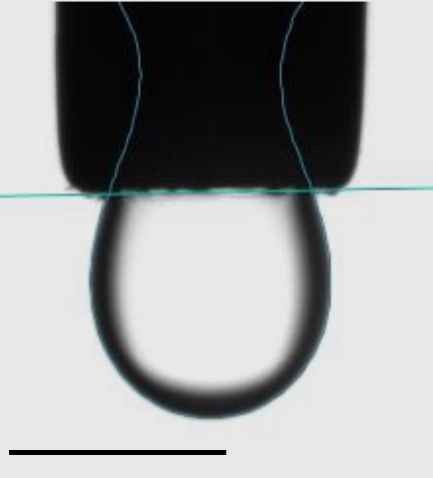
The Attension Theta Flex optical tensiometer with the PD200 pulsating drop module (Fig. 1) was used to measure interfacial dilatational rheology. Drops of fluorinated oil (ρ=1.6 g/cm3) which are common filler fluids in microfluidics were suspended from a 22-gauge stainless steel needle with volumes between 20-100 nl (Fig. 2). The oil was surrounded by an aqueous phase (ρ=1.024 g/cm3) which contained proteins and other biomolecules. Eight different oil formulations were studied and the aqueous phase remained constant. After forming the drop, 5 min elapsed so that an equilibrium interfacial tension was reached. Then the drop oscillated sinusoidally at 0.1, 0.2, 0.5 and 1.0 Hz with a change in interfacial area of approximately 10%. Through preliminary measurements, this amplitude was determined to be within the linear viscoelastic region (LVE) over the range of frequencies studied. Images of the drop were recorded and analyzed in OneAttension to determine the interfacial tension and area in each image. The resulting interfacial tension and area versus time data were further analyzed in OneAttension to automatically generate the elastic and viscous components of the complex interfacial dilatational modulus.
Using Interfacial Elasticity as a Predictor of Drop Stability
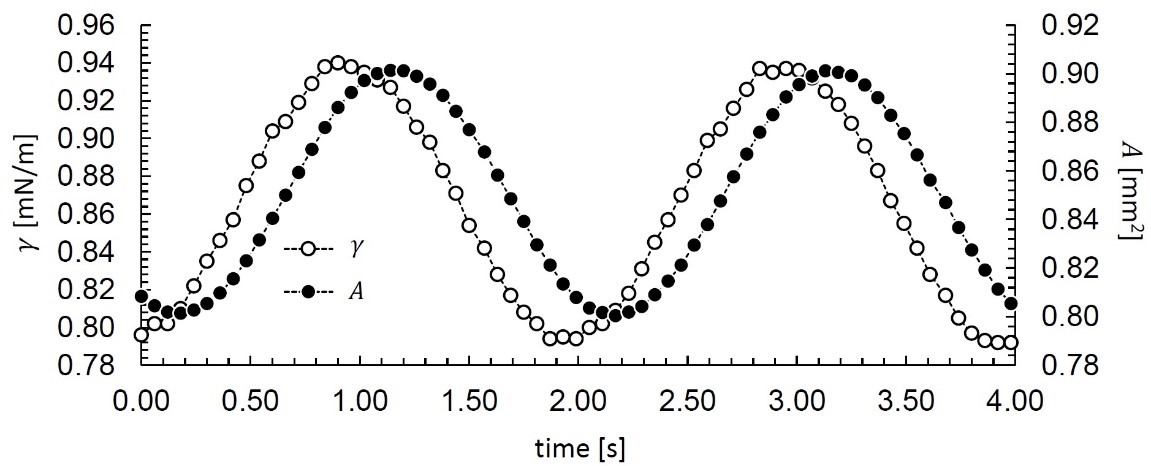
Figure 3 shows two representative periods from sample #3 measured at 0.5 Hz. The interfacial area, A, oscillates between 0.8 and 0.9 mm2, and the interfacial tension, γ, oscillates between 0.79 and 0.94 mN/m. The two sets of data are out of phase, which is indicative of a viscoelastic film at the oil-water interface. Using OneAttension, this data is automatically fit to

where |E| is the complex dilatational modulus, E’ is the elastic component (real component), and E” is the viscous component (imaginary component) [7]. Similar sets of γ(t) and A(t) are generated for the other 7 samples and analyzed with Eq. (1) to get their interfacial viscoelastic properties.
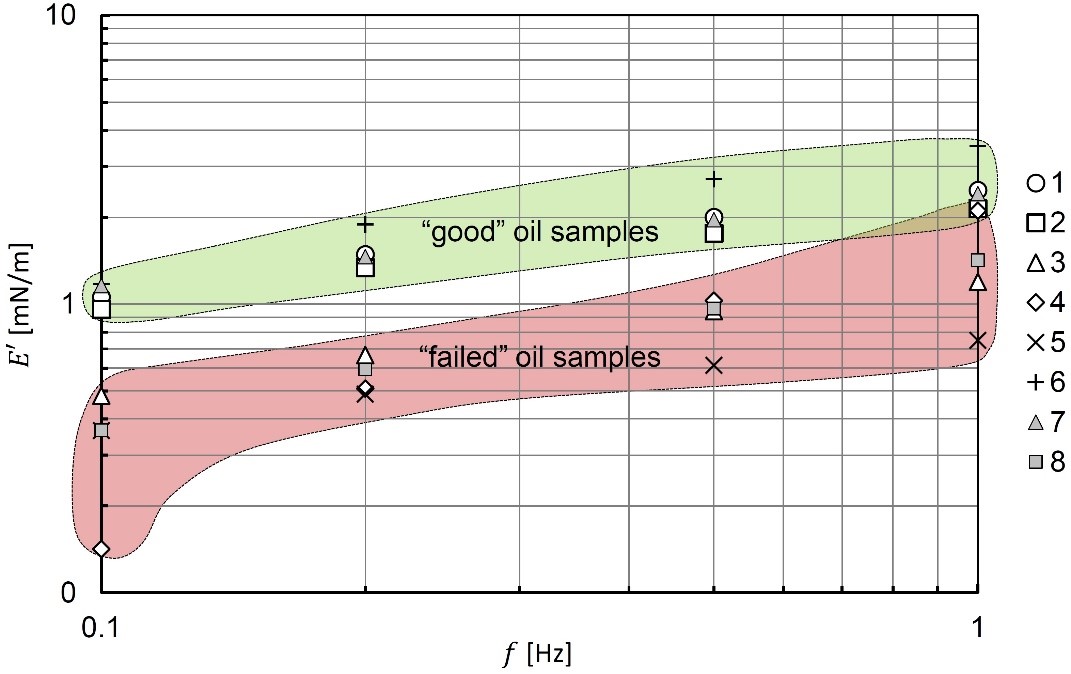
The resulting interfacial elasticity E’ is plotted for all eight samples in Fig. 4. Clear separation between two sample groups is observed in this plot. Specifically, samples #3, #4, #5, and #8 are grouped and have lower E’, while samples #1, #2, #6, and #7 are grouped and collectively have higher E’. Generally, a higher elasticity corresponds to a drop that is more stable and less likely to coalesce. When drops coalesce, the process is similar to the rupture of thin films. When the film is more elastic, it is better suited to resist rupture or coalescence. Indeed, samples #1, #2, #6, and #7 were revealed to perform best in the real system, whereas the other samples gave poor performance. To better distinguish the two groups of samples in Fig. 4, the “good” samples are circled in green and the “failed” samples are circled in red. Therefore, it can be seen from Fig. 4 that the interfacial elasticity, and specifically a higher elasticity, is an indicator for drop stability. This result agrees with similar observations from the literature [6].
Using Interfacial Rheology for Quality Control
In this note we demonstrated that interfacial elasticity measurements using an Attension Theta Flex can distinguish systems with stable drops from systems with drops that are prone to coalesce. Thus, by establishing pass/fail criteria, these measurements can be used for quality control as a quick, quantitative, and cost-effective solution. For example, based on the results shown in Fig. 4, if measurements are made at 0.1 Hz the criterion for passing the sample could be E^’>0.8 mN/m. The principles demonstrated here can be applied outside of droplet-based microfluidics as well, to food emulsions [1], pharmaceuticals [2], personal care products [2], and oil and gas emulsions [10].
- [1] D.J. McClements. Critical review of techniques and methodologies for characterization of emulsion stability. Critical Reviews in Food Science and Nutrition 47 (2007) 611-649.
- [2] H. Masmoudi, Y. Le Dreau, P. Piccerelle, J. Kister. The evaluation of cosmetic and pharmaceutical emulsions aging process using classical techniques and a new method: FTIR. International Journal of Pharmaceutics 289 (2005) 117-131.
- [3] R. Zilionis, J. Nainys, A. Veres, V. Savova, D. Zemmour, A.M. Klein, L. Mazutis. Single-cell barcoding and sequencing using droplet microfluidics. Nature Protocols 12 (2017) 44-73.
- [4] B. El Debs, R. Utharala, I.V. Balyasnikova, A.D. Griffiths, C.A. Merten. Functional single-cell hybridoma screening using droplet-based microfluidics. Proceedings of the National Academy of Sciences 109 (2012) 11570-11575.
- [5] I. Lignos, S. Stravrakis, G. Nedelcu, L. Protesescu, A.J. DeMello, M.V. Kovalenko. Synthesis of cesium lead halide perovskite nanocrystals in a droplet-based microfluidic platform: Fast parametric space mapping. Nanoletters 16 (2016) 1869-1877.
- [6] D. Georgieva, V. Schmitt, F. Leal-Calderon, D. Langevin. On the possible role of surface elasticity in emulsion stability. Langmuir 25 (2009) 5565-5573.
- [7] R. Myrvold, F.K. Hansen. Surface elasticity and viscosity from oscillating bubbles measured by automatic axisymmetric drop shape analysis. Journal of Colloid and Interface Science 207 (1998) 97-105.
- [8] F. Ravera, G. Loglio, V.I. Kovalchuk. Interfacial dilatational rheology by oscillating bubble/drop methods. Current Opinion in Colloids & Interface Science 15 (2010) 217-228.
- [9] S.M.I. Saad, A.W. Neumann. Axisymmetric Drop Shape Analysis (ADSA): An Outline. Advances in Colloid and Interface Science 238 (2016) 62-87.
- [10] H.-Q. Sun, L. Zhang, Z.-Q. Li, L. Zhang, L. Luo, S. Zhao. Interfacial dilational rheology related to enhance oil recovery. Soft Matter 7 (2011) 7601-7611.