Introduction
Chemical mechanical planarization (CMP), also called chemical-mechanical polishing, is a critical set of processes in semiconductor manufacturing. CMP utilizes chemical etching and physical grinding with abrasive materials to level or planarize semiconductor components between layers, ensuring proper current flow and thermal dissipation in the finished product. While significant advancements have been made in semiconductor technology in recent years, understanding of CMP processes is incomplete [1]. Here we discuss how Quartz Crystal Microbalance with Dissipation Monitoring (QCM-D) can be used to simulate various CMP processes to characterize the molecular interactions taking place and optimize polishing slurries, process protocols, and more.
CMP in Semiconductor Manufacturing
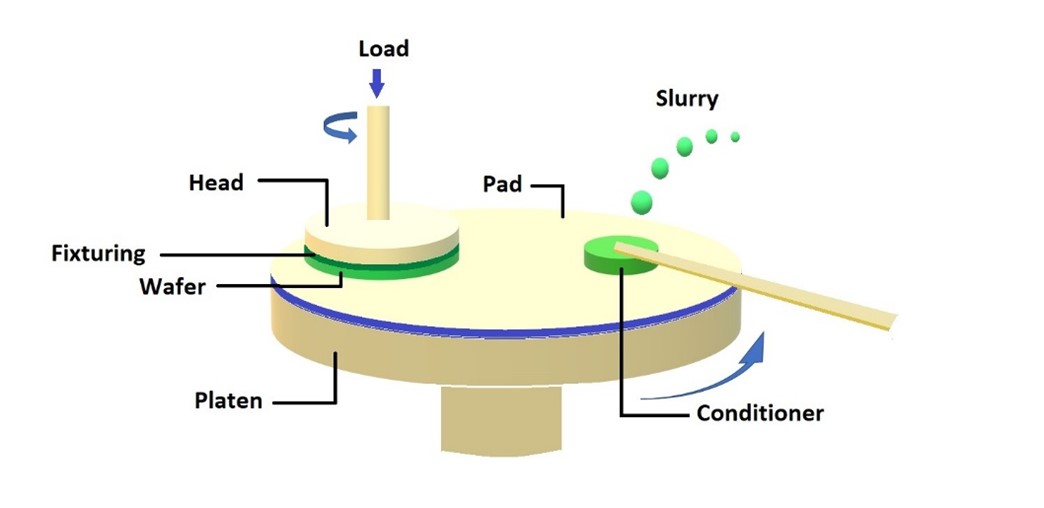
CMP is used at various stages of semiconductor fabrication, including front-end-of-line (FEOL), middle-of-line (MOL), and back-end-of-line (BEOL) processes. In simple terms, CMP uses abrasive particles suspended in a chemical slurry to interact with the wafer surface under controlled pressure and rotation, facilitating the removal of unwanted materials. A typical CMP setup is illustrated in Figure 1. CMP is pivotal for creating uniform interlayer dielectric and metal layers and ensuring a smooth topography for subsequent photolithography and metallization steps [1]. The process addresses variation in film thickness, planarity, and surface defects, and helps to reduce interconnect resistance while enhancing overall device reliability.
CMP combines chemical and mechanical processes to efficiently and effectively planarize semiconductor components. The careful balance between the chemical and physical components of CMP slurries helps to ensure that enough material is removed without corroding or damaging the circuitry and other critical structures. Therefore, it is important to understand the chemistry and the surface interactions for the development of new slurries and CMP protocols. With QCM-D, it is possible to study surface processes related to slurry additives and their interaction with the surface materials. Examples of such experiments include assessing how the slurry additives interact with the target surface, how the effects of additives vary with their concentration, how slurries etch the surface materials, and measuring the additive removal rates.
Quartz Crystal Microbalance with Dissipation Monitoring (QCM-D)
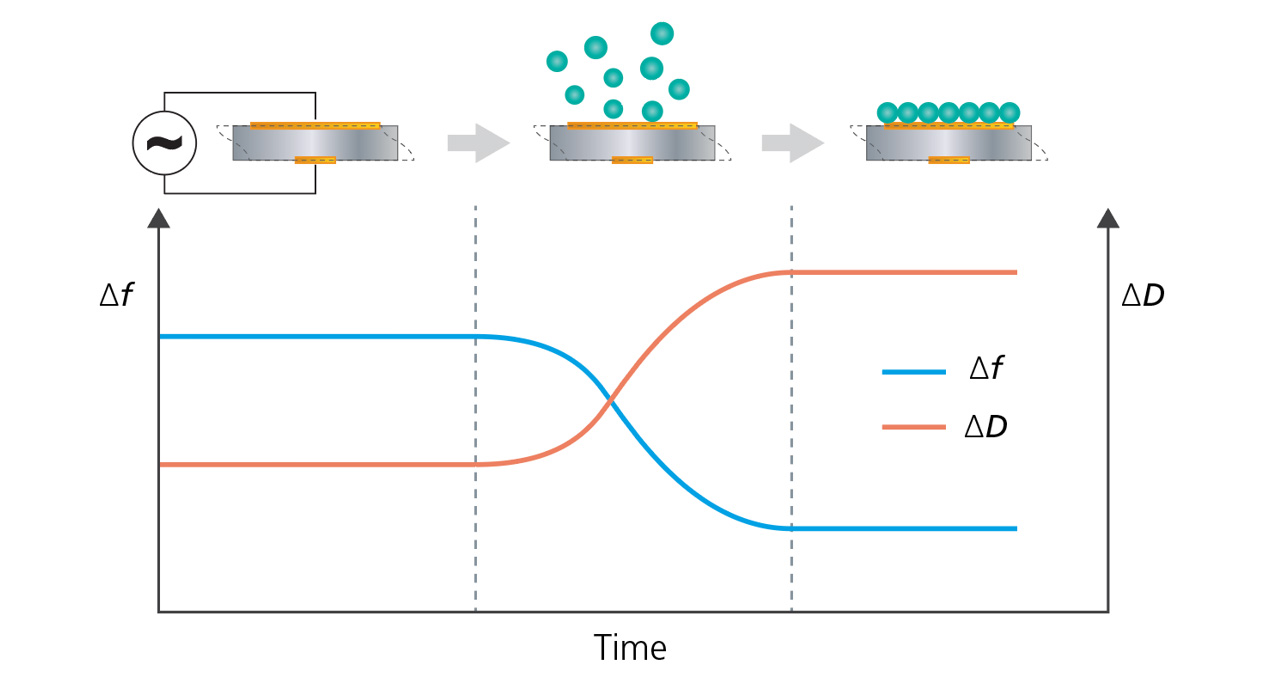
QCM-D is an analytical technique that operates by measuring changes in the resonance frequency (Δf) and dissipation (ΔD) of a quartz crystal (also sometimes referred to as a sensor) as matter is deposited or removed from its surface in real-time. The frequency values (Δf) reflect changes in mass as material adsorbs or desorbs from the sensor surface, while the dissipation parameter (ΔD), provides information about energy losses as the sensor comes to rest, which can be correlated to certain viscoelastic properties (Figure 2).
In addition to allowing the use of different sensor surface materials, surface coatings can be applied to the quartz crystal sensor to mimic real-world conditions for various processes that occur at surfaces and interfaces. QCM-D provides unique data in the study of surface interaction processes, enabling in situ quantification of mass, thickness, and viscoelastic changes of surface material or coating. Interactions and events that can be analyzed include adsorption, desorption, molecular binding, and structural changes such as swelling and crosslinking.
QCM-D is typically an aqueous technique and is sensitive to changes in hydrated mass, i.e. the mass of both the molecules adhering to the surface and the coupled solvent. This makes it an excellent technology to analyze systems where the layer conformation, structure, and degree of hydration vary with the measurement conditions.
QCM-D provides insights into the dynamic interactions between polishing slurries, abrasive particles, and substrate surfaces. Using QCM-D technology, it is possible to precisely monitor and control the CMP process parameters to quantify material removal rates, characterize the interactions between slurry ingredients, assess etching behavior and etching rates, optimize post-CMP cleaning protocols, and draw additional conclusions by applying different models to the resulting data. A few examples of slurry and CMP process parameters that can be varied include the surface material/surface chemistry, solution pH, temperature, chemical additives, and concentration of the chosen additives.
Analysis of a CMP process using QCM-D
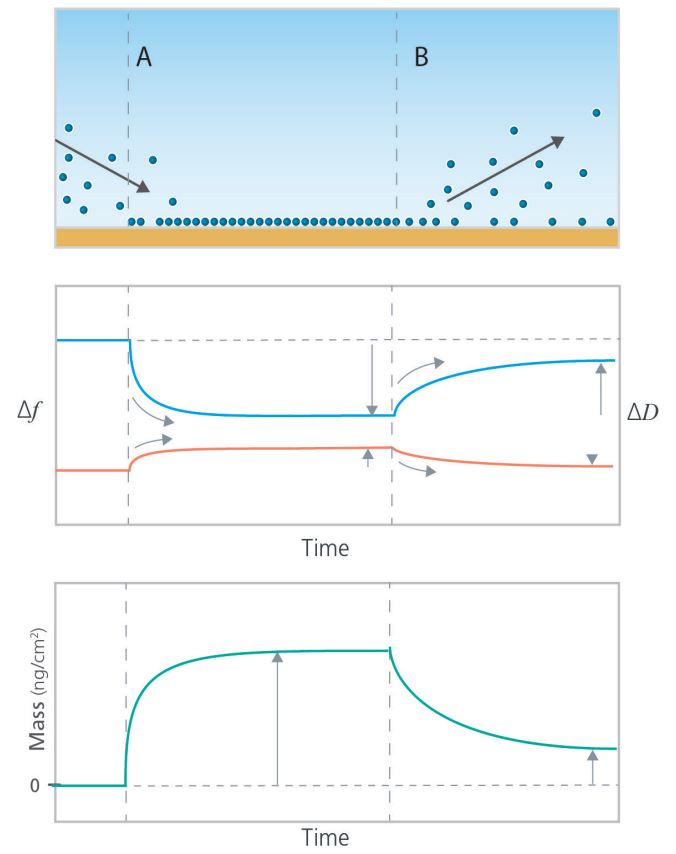
A simple example of how QCM-D technology addresses important questions related to CMP processes is an experiment that monitors mass uptake and mass loss from a surface exposed to various samples and chemicals. The measurement relies on tracking Δf and ΔD parameters, where Δf represents mass change and ΔD signifies the viscoelasticity of the layer. This data, illustrated in Figure 3, can be used to quantify the layer mass, thickness, and viscoelastic properties.
Since the data collected is time-resolved, it is possible to correlate the adsorption and desorption processes to the resulting data plots, as indicated by the grey arrows in the schematic graphs in Figure 3. These correlations also help determine how quickly the processes occur and the mass of the material that is added to or lost from the surface. The amount of material adsorbed to, and desorbed from, the surface can also be determined by quantifying the time-resolved layer mass, which is shown in the bottom panel of Figure 3, or using their viscoelastic properties, which is not depicted here.
In general, QCM-D is an excellent tool for assessing whether a molecule of interest adsorbs to a specific surface material at relevant conditions and allows the exploration of molecule adsorption dynamics. Additionally, it enables the characterization of molecular arrangement at the surface and supports the optimization of the surface or solvent conditions to minimize or maximize adsorption.
Characterizing Slurry Additive: Surface Interactions

Using the time-resolved QCM-D measurement, it is possible to monitor how additives, additive mixtures, and abrasives interact with the surface of interest. The adsorption and desorption processes can be assessed in terms of the speed, and the amount of materials adsorbed or desorbed from the surface as a function of the different chemicals used, surface, and solvent conditions, as shown in Figure 4. As QCM-D also senses the mechanical properties of the surface-adhering layer, it is possible to analyze the arrangement of the adsorbed molecules via quantification of layer thickness and viscoelastic properties.
In this example, four different measurements are illustrated, in which the concentration of the additive, surface, or the additive itself is varied relative to the measurement conditions in the first experiment, represented in 4A. In the experiment depicted in 4B, the additive concentration is reduced. In 4C, the surface material is changed. In 4D, a different additive is used. The time-resolved mass curves reveal the additive–surface interaction rate and the additive net mass uptake in the respective measurement.
Assessment of Surface Etching Behavior of Slurry Formulas
QCM-D can be used to analyze etching processes by measuring the loss of mass from a surface. Exposing the sensor surface to the slurry, or etching solution of interest, the etching process can be monitored as a function of time, as illustrated in Figure 5. In the schematic example, the etching behavior of two different slurries, A and B, were compared. In this experiment, the measurements started with bare surfaces in a non-etching solution to establish stable baselines. Thereafter, the slurries, or etching solutions to be studied, were introduced and the sensor material loss was monitored as a function of time. Finally, the slurry was rinsed away, and the net material loss could be quantified and compared. The QCM-D data demonstrates that Slurry A etches the material faster than Slurry B, and the net material loss is higher for Slurry A when the experiment ends.
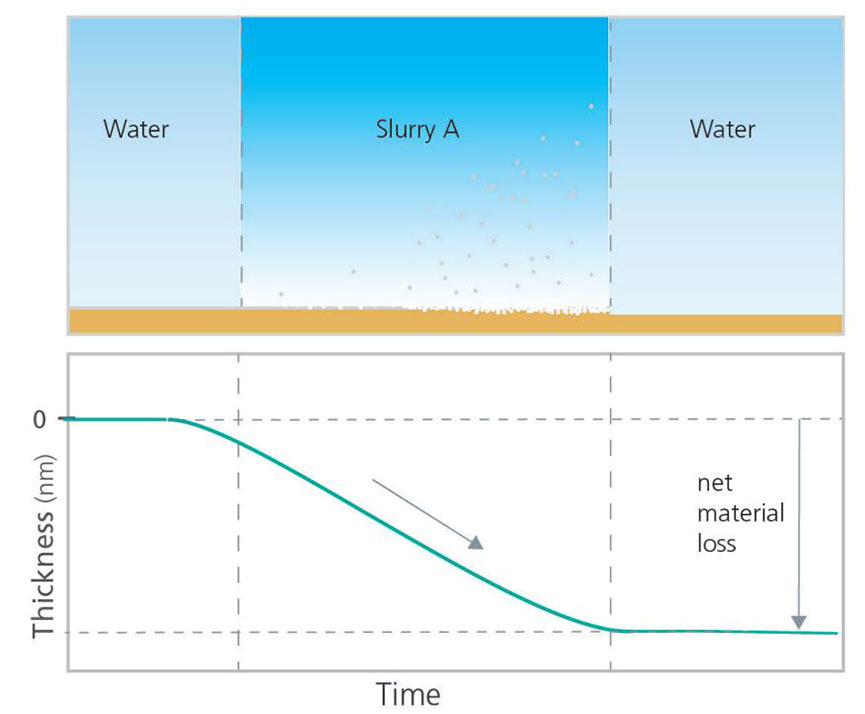
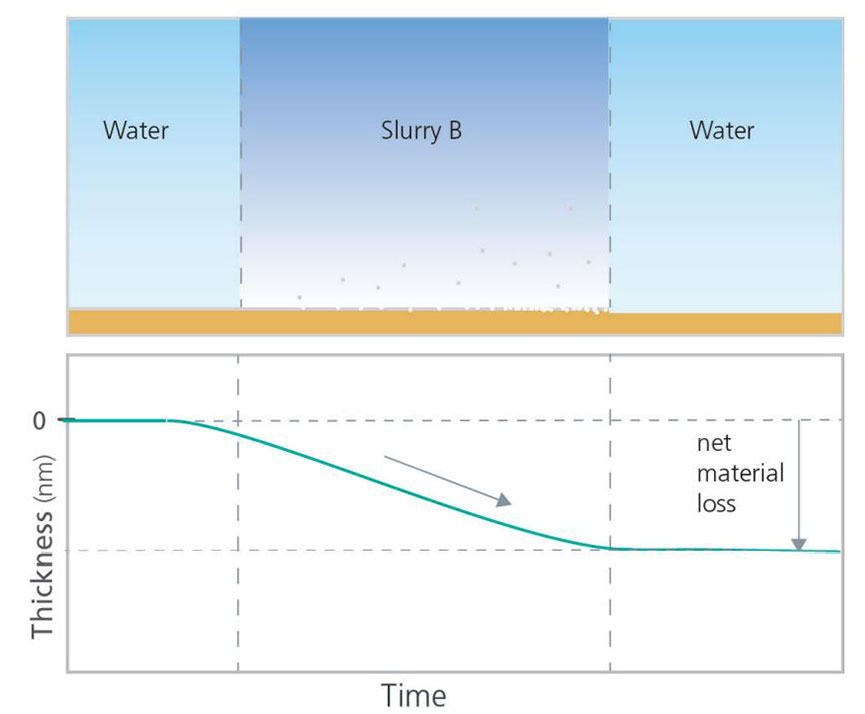
Figure 5. Schematic illustration of how QCM-D can be used to study etching behavior.
Variations of this experiment can be carried out to quantify the etching behavior of slurry formulas on different surface materials or investigate how the additive concentration affects the etching behavior. QCM-D analysis can also help explore the complexities of etching processes, such as in cases where the slurry component first adsorbs to the surface before etching. Other studies into etching behavior could include the measurement of etching rates, or assessing how quickly the etching stops when the slurry is removed from the surface.
Post-CMP Analysis for Cleaning and Slurry Removal
QCM-D technology can also be used to explore how to best remove post-CMP residues. In the case illustrated in Figures 6A and 6B, the cleaning efficiency and residue removal were analyzed by looking at the mass loss, i.e. the mass removal rate and the total amount of mass removed. To run such an analysis, the chemical to be analyzed should be added first to build up a layer at the surface. Then the surface adhering layer can be exposed to the cleaning agent of interest while monitoring the mass removed as a function of time. By comparing the removal rates and net mass loss, the efficiency of different cleaning agents can be assessed. In this example, Cleaning Agent I would be considered both faster and more efficient at removing the post-CMP residue than Cleaning Agent II. Additional experiments of this nature can also help identify the optimal concentration of cleaning agents to use for post-CMP cleaning protocols.
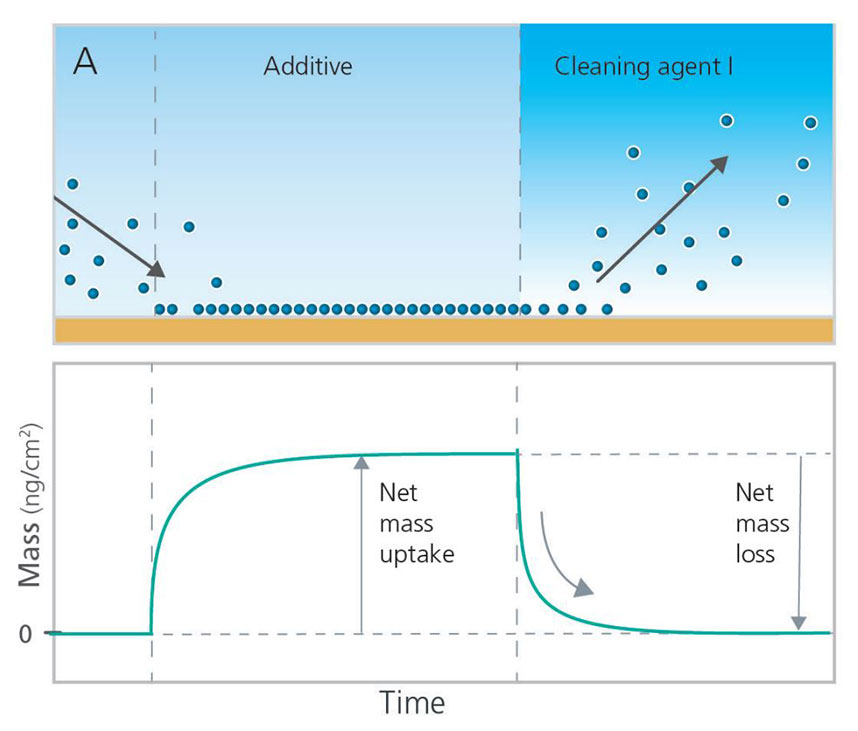
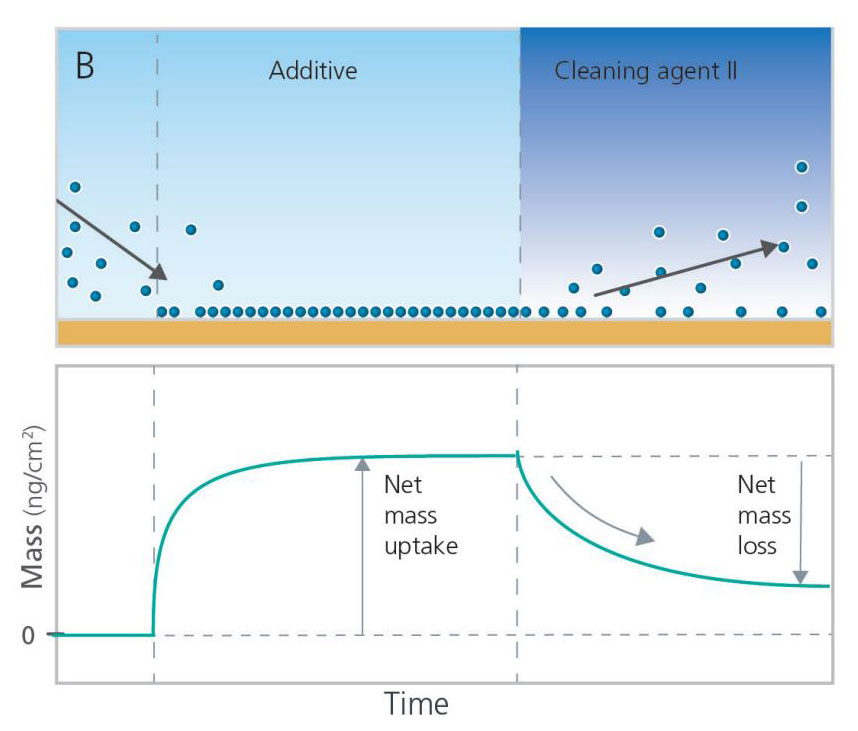
Figure 6. Schematic illustration of QCM-D experiments investigating cleaning efficiency and residue removal of post-CMP cleaning agents.
Case Study
This case study demonstrates how QSense® QCM-D can be used to study slurry additive and abrasive interaction with surface materials relevant to the electronics industry.
Analyzing the Interaction of CMP Slurry Additives and an Abrasive with a Ceramic Surface
In this study, the goal was to characterize the surface interaction of a certain abrasive and assess how this interaction was affected by the presence of different additives. The study also analyzed how mixtures of the different slurry components interacted with the surface material of interest, and if the components as well as the mixtures could be removed by rinsing.
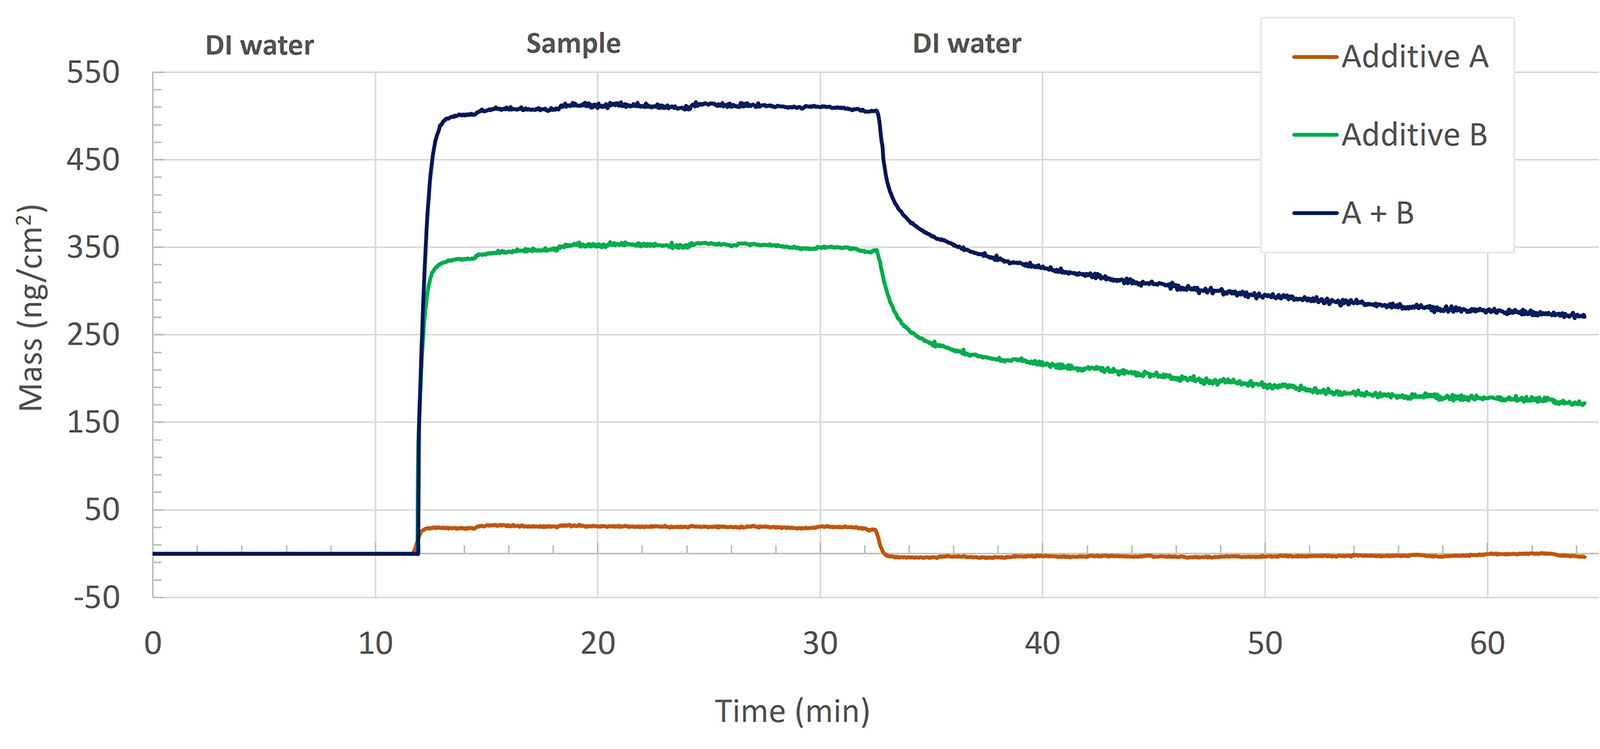
QSensors coated with a material of interest (a ceramic) were prepared by exposure to UV-Ozone for 20 minutes followed by vigorous cleaning in a stream of N2 gas. Three different additives (A, B & P), and their mixtures (A + B & A + B +P) were used in this study. QCM-D experiments were performed in triplicates at 25 °C, and the solution flow rate was 40 μL min-1. Baselines of the bare sensors in deionized (DI) water were collected for 10 min. The sample solutions were flown over the sensor surfaces (20 min) and real-time surface interactions were monitored by recording the frequency (∆f) and dissipation (∆D) changes. The surfaces were rinsed with DI water for 30 min. The collected raw data, ∆f and ∆D, were analyzed with QSense software to extract the quantified mass, Figures 7 and 8.
Additives A, B, and mixture A+B
The additives A, B, and their mixture, A + B show very different interactions of these components with the surface, based on the mass uptake. The insertion of additive A results in the characteristic signature of a bulk shift, i.e. a shift that is reversible upon rinse. The reversible shift indicates that the interactions between additive A and the ceramic surface are insignificant and that no additive remains at the surface after rinse. Additive B, on the other hand, shows a large mass uptake upon interaction with the surface, Figure 7. In the rinse step, some of this mass is removed. The mixture of the two additives A+B also led to irreversible mass adsorption, similar to the behavior of additive B. The magnitude of the uptake, both before and after rinse, is however larger for the mixture A+B than for the mass uptake of additive B.
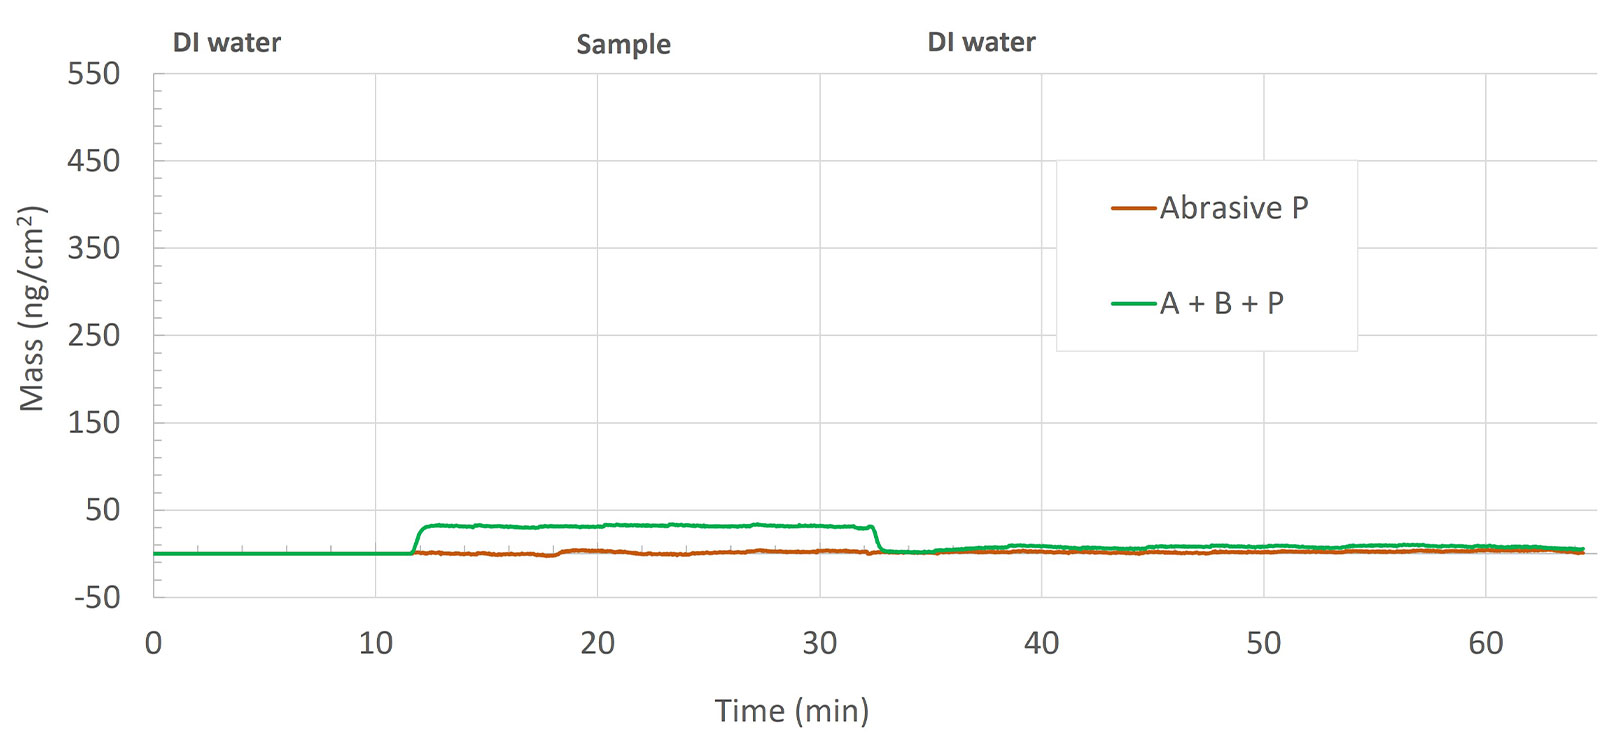
Abrasive P and mixture A+B+P
Looking at the quantified mass for the abrasive-surface interaction, Figure 8, the result indicates that the interaction between the abrasive P and the ceramic surface is insignificant.
The abrasive mixture, A+B+P adsorbs onto the surface but is almost completely reversible upon rinse with DI water. This mixture also forms a rigid layer at the surface, as indicated by near-zero dissipation value (data not shown).
Results
The two additives, A and B, show significantly different behavior when exposed to the ceramic surface. The introduction of additive A predominantly showed a bulk shift, and after rinse, no additive remained at the surface analyzed. Additive B, on the other hand, followed a typical Langmuir adsorption profile and rapid desorption kinetics upon rinse with DI water. This rapid desorption together with the behavior of the dissipation value (not shown) indicates that additive B adsorbs and forms a layer that strongly interacts with the surface. On top of this strongly adhering layer, there are additional molecules that are loosely bound, and which are removed in the rinse step, leaving only the mass of the strongly interacting molecules after the rinse.
When the additives A and B are combined into a mixture, something interesting happens. The analysis reveals that the surface interaction dynamics of the mixture are similar to that of additive B, but more importantly, it also reveals that the magnitude of the mass uptake is much larger than what would have been expected if the two additives had interacted with the surface in the same way as when they were exposed to the surface as individual components, i.e. the mass uptake of the A+B mixture was larger than the sum of the individual mass uptake of additives A and B. The analysis hence reveals that the two components are interacting with each other when combined into a mixture and that the complexes formed result in an overall thicker layer at the ceramic surface than either of additives A or B alone. The mixture of the abrasive with the two additives resulted in the formation of a very thin and rigid layer on the ceramic surface, which was then removed by DI water during the rinse step.
Concluding Remarks
This study intended to analyze the interaction between a ceramic surface and different slurry additives, abrasive particles, and combinations thereof, as well as how easily they were removed from the surface by rinsing with DI water. QSense QCM-D analysis revealed how different slurry additives, additive components, and mixtures interact with the target surface. The time-resolved information provided detailed insight into the surface–molecule interactions. This new detailed insight could be of value when exploring and optimizing CMP slurries, processes, and protocols.
In conclusion, QCM-D analysis provides a powerful toolset for gaining insights into the chemical aspects of CMP processes. The technique enables the investigation and characterization of surface materials, additives, and slurries, quantifying their performance and behavior in real-time.
References
[1] Seo, J. A review on chemical and mechanical phenomena at the wafer interface during chemical mechanical planarization. Journal of Materials Research 36, 235–257 (2021). https://doi.org/10.1557/s43578-020-00060-x