
Cyclic voltammetry (CV) is one of the most popular techniques used for electrochemistry experiments and is commonly used to study oxidative and reductive processes. This technique involves measuring the current that is generated during the redox process when the voltage is varied between the electrodes. CV can be used to assess the redox properties, charge-discharge mechanisms, and electrochemical stability of materials. Cyclic voltammetry can distinguish reversible, quasi-reversible, and irreversible behavior in electrochemical systems.
Cyclic voltammetry of batteries is performed at slower scan rates than traditional solution electrochemistry experiments but can still reveal some of the important parameters associated with electrochemical reactions. Qualitative interpretations are also relevant.

CV to investigate Lithium-ion batteries:
Cyclic voltammetry has been used to investigate lithium-ion batteries [1]. Many factors affect the shape of the cyclic voltammogram of lithium-ion batteries including particle size of the active material, electrolyte concentration, electrode thickness, and temperature.
As the active material particles get smaller, the interfacial surface area increases, with a shorter diffusion length leading to an increase in the kinetics of electron transfer as well as the capacity because of increased access of the electrolyte to the particle surface. Different electrochemical performances can be observed with changes in particle size which leads to the possibility to tune the electrochemical reaction mechanism. Particle size can also influence the ratio between the contribution to capacity from Lithium-ion intercalation and capacitance.
Electrolyte concentration only has a small effect on voltammograms of lithium intercalation compounds because the diffusion of lithium within the material is much slower than in solution. In some cases, sharper peaks can be observed because of faster kinetics.
Increased electrode thickness causes the peaks in the cyclic voltammogram to separate due to slower lithium-ion diffusion from the surface into the bulk of the electrode. There may also be a potential drop across the electrode due to this thickness.
Chemical reactions, generally, have faster reactions at higher temperatures. The electrochemical reaction in a battery depends on lithium-ion diffusion in the active material which is temperature sensitive. This can lead to the peak onset shifting to a lower potential as the temperature increases.
Sweep rate investigations can also be used on batteries, but the traditional equations for solution electroactive species are difficult to modify for Li intercalation systems. Lithium intercalation reactions tend to be quasi-reversible in nature and the cathodic and anodic peaks are scan-rate dependent. The peaks tend to shift to higher potentials with increasing scan rates. Depending on the scan rate, the peak height can either be dependent on the square root or have a linear relation. The specific capacity can also be obtained by voltammetry by integrating the area under the cyclic voltammogram.
Differential Capacity Analysis:
Cyclic voltammetry of whole batteries is not as common as with the constituent parts of the battery. This is partially because of the complex nature of the whole system where responses from both electrodes are difficult to deconvolute. Differential capacity analysis has been used as an alternative method to cyclic voltammetry for observing the phase transitions of the electrode material during the charging process. This is similar to cyclic voltammetry; however, one difference is that cyclic voltammetry contains rate information. Other differences come from the driving force for the electrochemical reactions.
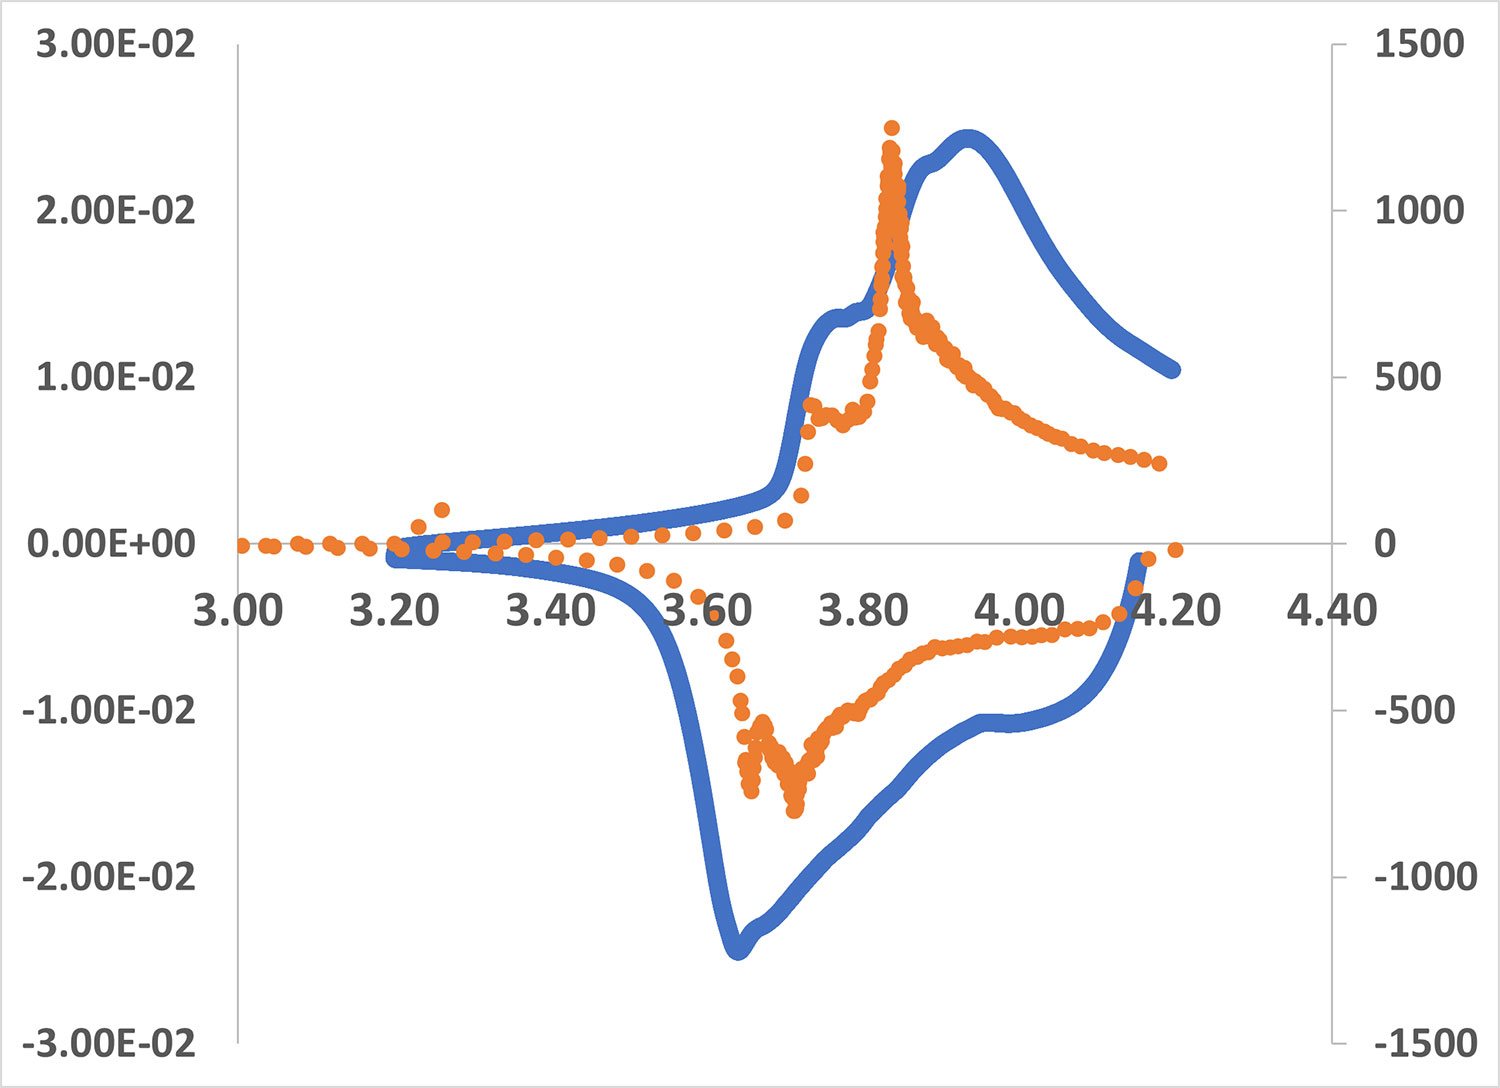
In the case of the CV, the voltage changes linearly with time whereas in differential capacity analysis, the current is maintained constant and depends on the reaction happening inside the battery. The constant current experiments have a constant IR voltage drop component as CV changes due to varying currents. The differential capacity analysis involves calculating the slope of the constant current charge data in the form of a dQ/dV vs. V plot. This leads to a shift in the peaks when you compare a CV plot against a dQ/dV vs. V plot. Figure 1 shows an overlay of the differential capacity curve (orange) and the cyclic voltammogram (blue) for a lithium-ion coin cell. The peaks in the differential capacity curve are much sharper and shifted to lower potentials than in the CV. This is the effect of IR drip due to the varying current in the case of the CV. dQ/dV vs. V plots are also used to examine the decomposition of the battery as it is cycled. It is possible to distinguish between conductivity loss, loss of lithium due to electrolyte decomposition or lithium plating, and loss of active material. One study on calendar aging (the degradation of batteries not due to cycling) extensively used DCA to identify the sources of degradation and possible mitigation strategies [2].
Conclusion
Cyclic voltammetry is a useful tool for investigating Lithium-ion batteries. Analysis of battery properties with cyclic voltammetry can help tune the battery reaction mechanisms, study the influence of electrolyte concentration, and investigate the effect of electrode thickness, and temperature effects. In conjunction with other tools, it can give us a greater understanding of what factors influence the performance of batteries. Differential capacity analysis is an analogous evaluation tool that can identify phase transformations in intercalation materials. It has been used to identify the sources of degradation to allow for mitigation.
References
[1] Kim, T. et al, J. Electrochem. Sci. Technol., 2020, 11(1), 14-25
[2] Peter Keil and Andreas Jossen 2017 J.Electrochem.Soc. 164 A6066